Over the past 20 years, I don’t know if there is a New York Rangers defenseman (outside of Adam Fox) that I have loved more than Ryan Lindgren. He has been the heart and soul of our defense for the past 5 years and has been one of the few assets acquired during the 2018-19 fire sale that panned out.
Lindgren is an absolute warrior. He must have been forged with Valyrian steel, as I can think of no other who has put his body on the line so many times and is still able to lace them up for 90% of the season. Yet for some reason, a faction of this fan base doesn’t seem to appreciate him.
I don’t if know if its because he’s never been an analytics darling, or if there just isn’t enough offense on his stick, but it still surprises me every summer when some fans pine for his removal. It makes you wonder what keyboard warriors would have thought of Jeff Beukeboom had he played in the era of apps.
Anyway, clearly you can tell I am a fan of Lindgren & value his skillset. And like I said in Mika Zibanejad’s report card, these grades (while subjective in nature) are based on their role within a team, our system, & how they compare against other players around the league who have comparable roles.
Let’s start with Lindgren’s role within Laviolette’s system, which is arguably one of the hardest on the team (save Igor). His job is to be a safety valve so Adam Fox can join the rush & produce offense.
In Lavi’s 2-1-2 forecheck and 1-3-1 neutral zone trap for regroups, Lindgren is the first man into the DZ. This means he’s tasked with stopping opposition forechecks, winning board battles on the left side, covering the slot (when the puck is on the right side), blocking shots, and breaking up plays.
As a result, Lindgren led all Rangers defensemen in defensive zone starts (179), which was also the most he has ever started in the defensive zone in his NHL career. What was the outcome? Well, it’s mixed depending on which metric you value.
According to PuckIQ, Lindgren was a +22, 48.5% for Corsi F% (shot attempts), 45.4% HDCF% (slot chances). Last season, he had 129 shifts in the defensive zone, was a +29, 54% for CF%, and 54.3% for HDCF%. So clearly this was a bit of a step back, in terms of the basic metrics. However, 50 more defensive zone shifts can’t be completely discounted.
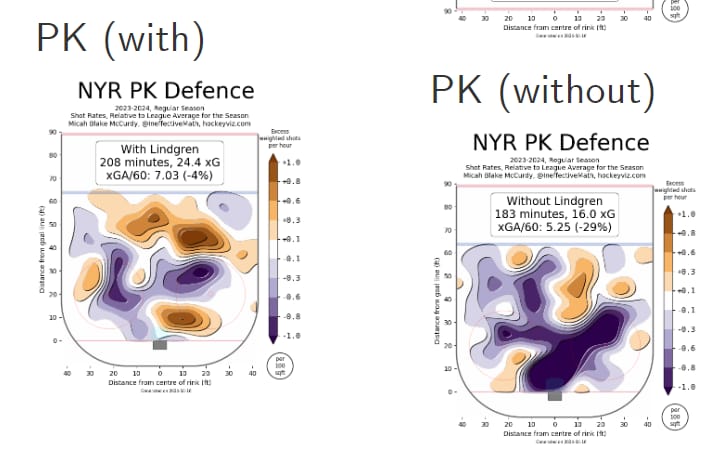
Lindgren’s other contribution historically has been the penalty kill. This season he logged 200+ mins. However, the Rangers were better at limiting chances on the penalty kill when he was on the bench (see heatmap below).
During the playoffs, Lindgren was last among Rangers defensemen in pretty much all of these stats. However, he supposedly played with cracked ribs.
As for some micro stats (courtesy of All Three Zones), Lindgren (12.6 per 60) was just behind Fox in defensive retrievals leading to zone exits and was league average (6.9 per 60) in botched retrievals. He was also just below league average at denying opposition entry into the defensive zone (8.7%). Last year, Lindgren delivered 9.9 retrievals per 60, 4.2 botched per 60, and 6% entry denials. So better in some areas & worse in others.
As I much as I love data, you do have to take this all with a grain of salt. There’s just so many variables that impact these things that are hard to account for. Lindgren took a step back this year for sure, but how much was a blip? We won’t know until next season. Hopefully he bounces back. If not, I doubt he will be re-signed. He’s not a top pairing defenseman but likely will end up being paid like one next summer.
Final Grade: B-
More About:Players