Earlier this week, there was some incomplete analysis done on the Rangers by someone who will not be mentioned in this post. To summarize poor conclusions, the conclusion was the Rangers are just goaltending and a powerplay, essentially just smoke and mirrors. For anyone watching this team, we know that to be a wild stretch of the truth.
Before we get into the actual numbers, let’s just evaluate the conclusion. Punishing the Rangers in an “analysis” for having top of the league goaltending and a top of the league powerplay sure is something, right? Who knew that goaltending and powerplays were actually useless and contribute, in no way, to the success of a team, right?
But again, let’s be fair and look into the lazy analysis and conclusion baiting by said “article.”
If I got some numbers wrong, it’s a transcription error and not one done on purpose. Please let me know and I will adjust.
Goaltending is still top tier
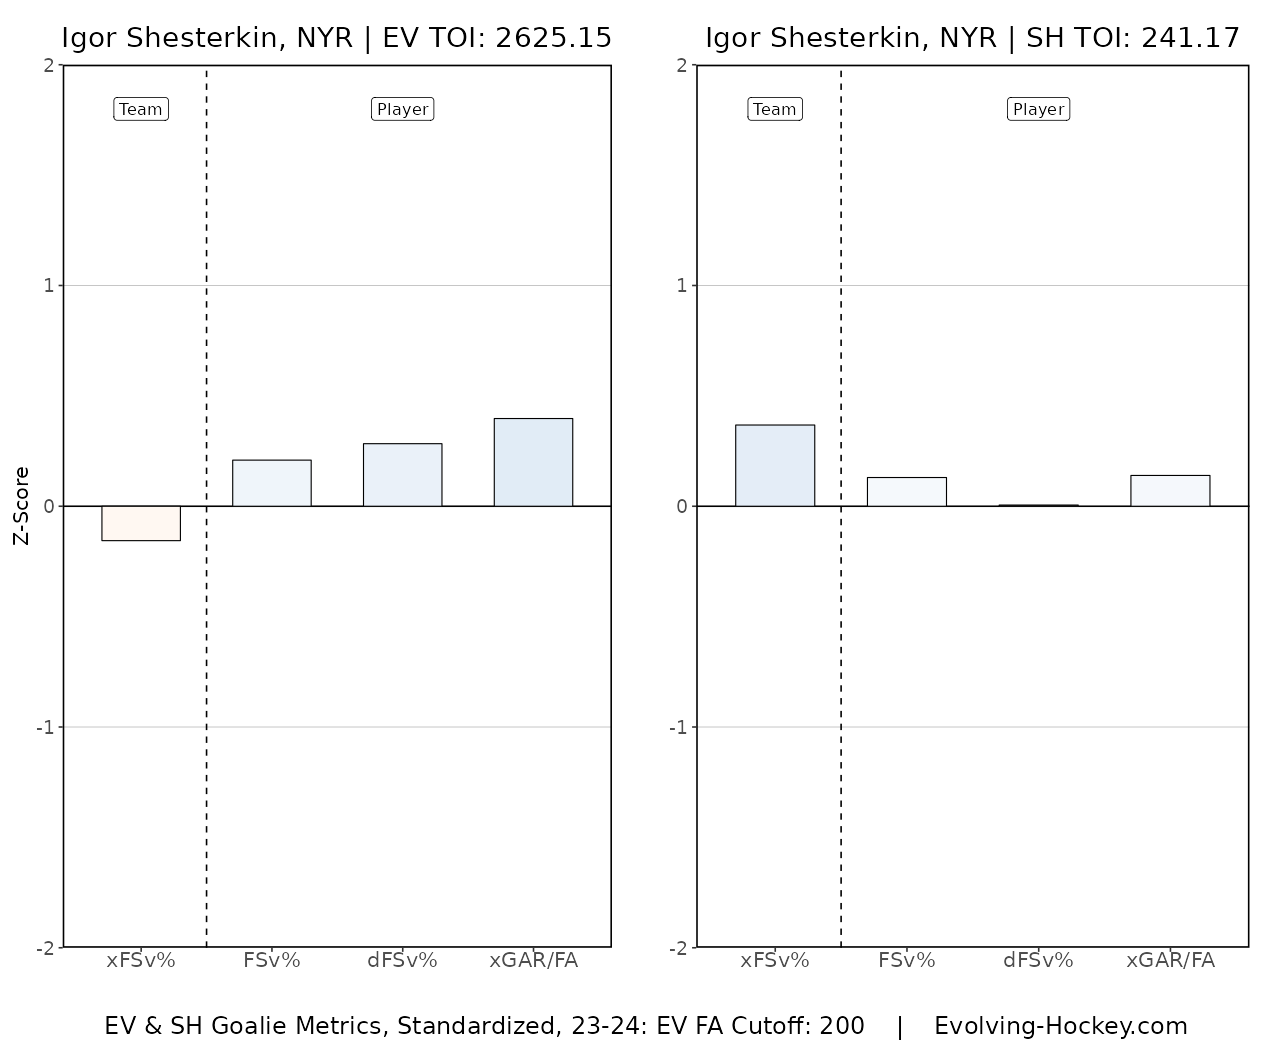
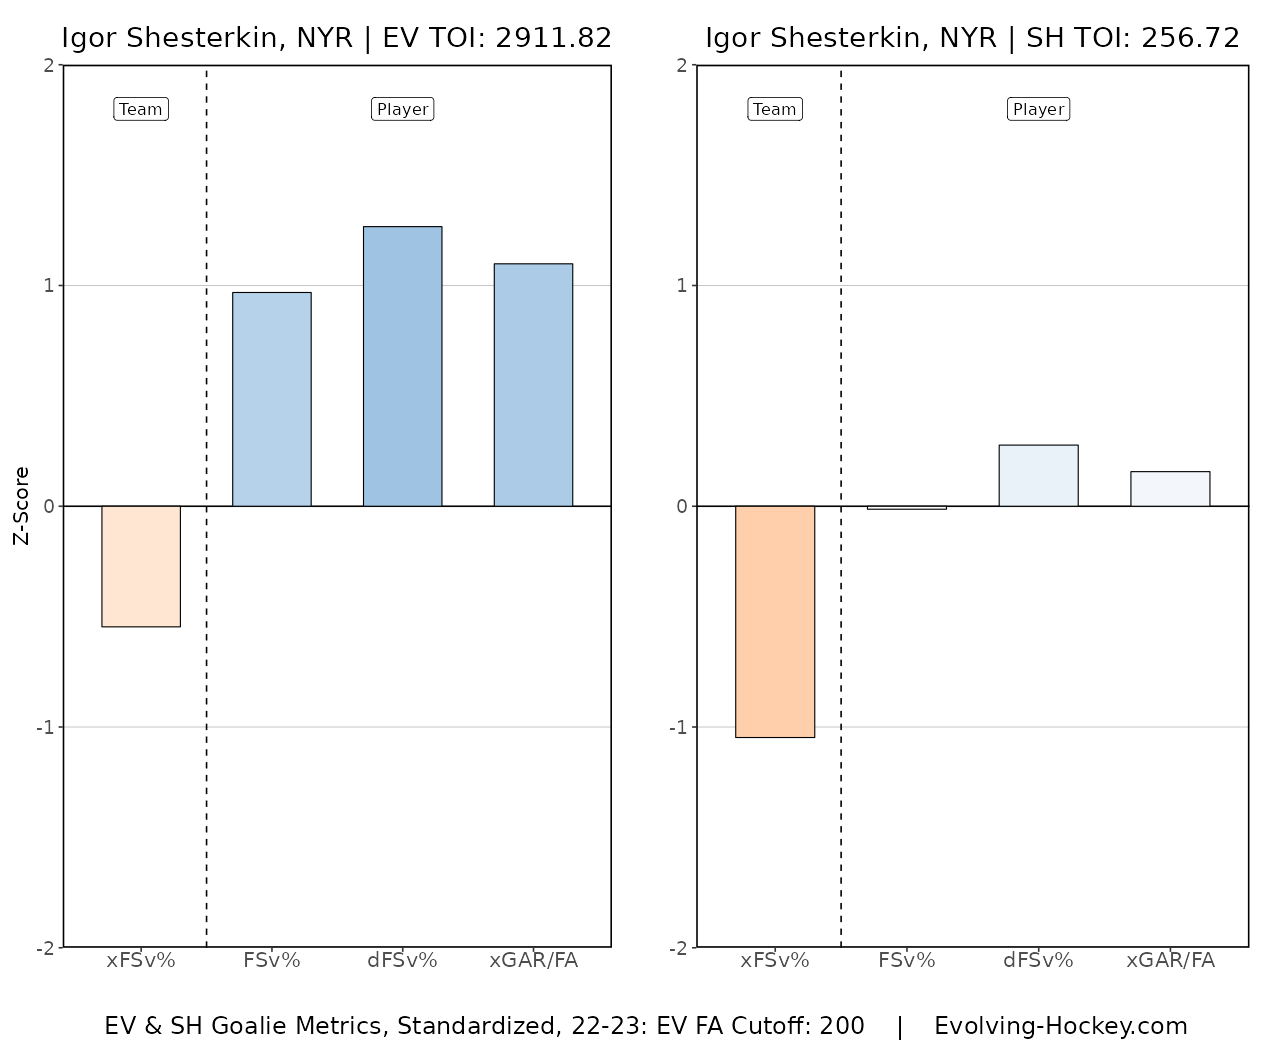
For starters, let’s look at the piece we all know to be true. The Rangers have elite level goaltending and an elite powerplay. Igor Shesterkin is currently carrying a .910 SV% and his overall splits look a little rough this year. His 2022-2023 numbers at 5v5 were far better.
Breaking that down a bit more, we look at that horrible December-January stretch where Igor was getting beat high glove regularly, a problem that has since been corrected by goaltending wizard Benoit Allaire.
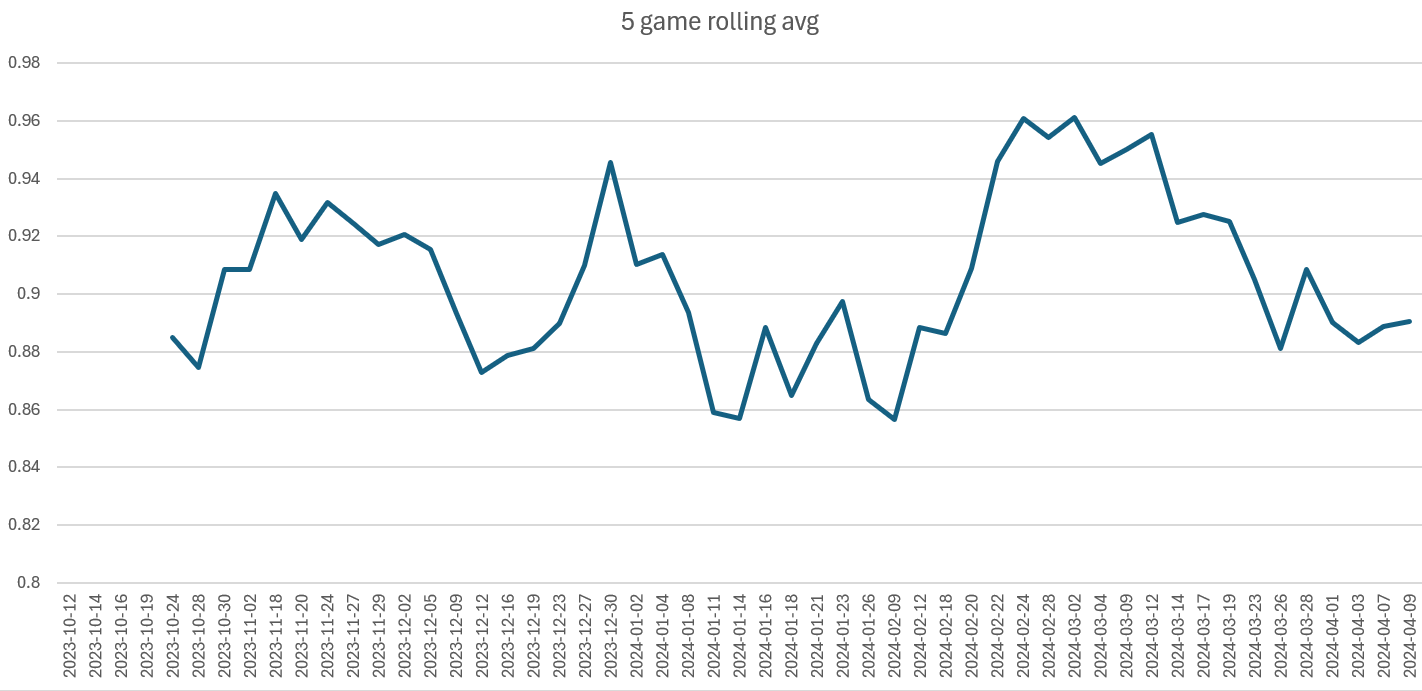
That dip from 12/30 lasted until 2/9, after the All Star break. Shesterkin then rocketed back into the Igor we expect. The last few games have been a bit rough, but that’s just normal ebbs and flows from the season. The crater in December-January was extended, making it exceedingly rare.
Powerplay effectiveness is in line with other Cup contenders
With Shesterkin covered and back into form, we can look at the Rangers powerplay. Powerplays are streaky by nature, and the Rangers are no different. They went on a 7 game stretch in late January/early February where they didn’t score at all with the man advantage.
For the full season, their powerplay clicks at 27%, second in the league. Funny enough, if you look at the top powerplay teams in the league, all of the top-10 are either in the playoffs or in the hunt (Detroit). In fact, 11 of the top 12 are in the playoffs, again with Detroit (9th) as the outlier at the moment.
For some reason, powerplay points by stars was cited as a problem, but that specific “article” misrepresented powerplay points percentage for Artemi Panarin, stating 66% of his 116 points are powerplay points. This is just objectively false, as Panarin has a line of 10-33-43 on the powerplay, which is 37%.
For those keeping score, that’s in line with Nathan MacKinnon, David Pastrnak, Nikita Kucherov, and other top scorers.
So why exactly is having a top powerplay a problem? The top contending teams all have top powerplays. Perhaps we are missing something?
Diving into the 5v5 shot metrics (full season)
With the apparent “flaws” of having a top powerplay and top goaltending covered, the meat of the “article” was covering the Rangers’ 5v5 “woes.” And let’s be real, the Rangers have never been and likely never will be 5v5 shot metric juggernauts.
Over a full season, here’s how the Rangers rank in shot metrics, per Natural Stat Trick:
- CF/60: 59.54 (17th)
- CA/60: 59.5 (17th)
- CF%: 50.01% (19th)
- xGF/60: 2.5 (22nd)
- xGA/60: 2.62 (20th)
- xGF%: 48.76% (23rd)
These are the only numbers truly cited, and it tells the story that the Rangers are powerplay merchants. But let’s look at where the last 10 Stanley Cup Champions ranked in CF% and xGF%:
- 2023 Vegas: 48.15% CF (22nd), 50.67% xGF (14th)
- 2022 Colorado: 52.87% CF (9th), 52.12% xGF (11th)
- 2021 Tampa: 52.37 (9th), 53.28 (9th)
- 2020 Tampa: 52.25 (5th), 53.67 (3rd)
- 2019 St. Louis: 51.18 (10th), 51.87 (9th)
- 2018 Washington: 47.96 (24th), 46.88 (26th)
- 2017 Pittsburgh: 50.14 (16th), 52.72 (5th)
- 2016 Pittsburgh: 52.72 (2nd), 55.44 (1st)
- 2015 Chicago: 53.60 (2nd), 50.68 (17th)
- 2014 LA: 56.82 (1st), 55.52 (3rd)
The further away we get from 2014, the less correlation between a top team in CF% and xGF% we have to Cup championships. That’s not to say generating shot attempts and expected-goals doesn’t matter, in fact it’s the opposite. We are seeing a shift away from “shoot from anywhere” towards generating quality attempts regularly.
That last piece is the important piece that we need to break down. By no fault of their own, the public models are very limited since the NHL isn’t overly great at providing second-level information. The type of information that is lacking in these models is exactly why the “article” I’m referring to is so flawed.
I’m sure we’ve all seen that Ted Lasso scene where he’s playing darts and quoting Walt Whitman. Instead of asking why, people are just assuming the Rangers are smoke and mirrors.
So let’s ask this: WHY are the Rangers winning and WHAT are they doing differently?
Rangers system of winning high danger chance battle matters
The Rangers have a unique system in place, one that I honestly haven’t seen before. From a tactics standpoint, all seems normal. They run a combined 2-1-2 forecheck with a 1-3-1 to protect leads. They clog the neutral zone and limit speed into the defensive zone.
In the defensive zone, they play a hybrid man (below the dots)/zone (above the dots) system. This is similar to what Alain Vigneault deployed but with far better direction and structure.
Nothing here seems out of the ordinary. However it’s the message and the purpose of these systems, combined with how the Rangers generate offense, that is unique. The Rangers are more than willing to cede low danger attempts to the opposition, trusting Shesterkin to make the save, and clearing the high danger chances. Basically protect home plate and keep shots to the outside.
To dive deeper, we need to see the percentage of attempts that are low danger, medium danger, and high danger.
- Total shot attempts against: 3805
- High danger attempts against: 716 (18.8%)
- Medium danger attempts against: 1020 (26.8%)
- Low danger attempts against: 2172 (57.08%)
These numbers are from NST, I didn’t make them up, and I’m sure you all see what I’m seeing. The total shot attempts against at 5v5 (3805) is less than the sum of the HD+MD+LD chances (3908). So right there, we know there’s a flaw in the data. But we truck through, since this is what was cited.
This is where things get interesting. The Rangers are 8th in the NHL in percentage of shot attempts against being low danger. This matters, as it plays into their system of forcing teams to the outside. They are 16th in percentage of HD chances against.
The LD chances seems right within the system. The HD chances, while not exactly stellar, is probably close to accurate given some of the defensive breakdowns we’ve seen all year. After all, we saw these numbers start to tank in November after the Rangers lost both Kaapo Kakko and Filip Chytil for extended periods of time.
For context: The Rangers lost two of their best defensive forwards for long stretches. No wonder why we see things, over the full season, look worse than expected.
Since the trade deadline, the Rangers are fine
If you’ve been here a while, you know that I prefer to use trends and not whole season performance. It doesn’t discount full season performance, but I believe it tells a more accurate story about a team, especially after the trade deadline when teams fill gaps.
For the Rangers, they added a pair of top-nine forwards to replace Chytil and to fill a clear need at 1RW. So for this to be more accurate, we should be looking at how teams are playing right now, post deadline. This is where things get fun.
- CF%: 52.92 (6th)
- xGF%: 51.01 (13th)
If I were snarky, this is where I’d stop and just simply state that a full analysis shows the Rangers are doing just fine with a full roster. But I’m not 100% snarky. So let’s look at how this works within the Rangers system.
- Total shot attempts against: 790
- High danger attempts against: 137 (17.34%)
- Medium danger attempts against: 201 (25.44%)
- Low danger attempts against: 461 (58.35%)
So within the system, the Rangers have been executing far better at limiting HD chances against and forcing teams to LD chances. The percentage of shot attempts that were both high and medium danger came down by at least a full percentage point, while the low danger chance percentage went up over a full percentage point.
Please note that we are still seeing that issue where the total is less than the sum of the parts.
Since the trade deadline, when the Rangers addressed some clear holes, they’ve not only been better by “traditional” possession metrics, but also better within their own system. This is also just a one-sided discussion on defense, completely excluding offense from the equation.
Before some folks nitpick this, both full season and since-deadline numbers matter, and both have flaws. Full season numbers don’t account for post-deadline roster additions. Post-deadline numbers have a small sample size. Nothing is perfect on its own.
And you know what the funny part was? The part of this post that took the longest to write wasn’t even the stats. It was sorting through Stanley Cup Champion data to find their ranks in the league. That part took the longest. The rest? About 15-20 minutes or so.
Conclusion (tl;dr)
The tl;dr summary: The full season numbers are what they are, but they are flawed analysis. The post-deadline numbers tell a different story, but is subject to small sample size. Both on their own are flawed, and even combined is still flawed.
You know why 5v5 numbers on their own are flawed? Special teams matter. Goaltending matters. Coaching matters. In-game adjustments matter. And for the Rangers in particular, finishing matters.
We can’t necessarily account for all of this in a simple stat, at least not yet with all the variables in hockey that aren’t available on the public data sites. Again, by no fault of their own, they are limited by what information the NHL provides.
It seems odd to consider elite special teams and goaltending as a “flaw” for a Stanley Cup contending team. Yet here we are, where the common and lazy consensus is that the Rangers are smoke and mirrors. Instead of taking the Ted Lasso approach and asking why the Rangers are so good despite middle of the road possession metrics, people just made a bad assumption.
Hockey is more than just a 5v5 game. The Rangers have a very unique formula to win: Win the high danger chance battle on a game by game basis. By doing so, they put themselves in a solid position to win because of Igor Shesterkin and because of their elite special teams.
The numbers are a generalization. Tactics and coaching matter and are not accounted for in the numbers. It’s fine to look at the Rangers possession numbers and say they have a hole in their game. It’s pointing out a truth. But to end there, without any other analysis? Lazy.
Every single team heading into the playoffs has holes. Carolina has a finishing concern. Boston has depth concerns, especially at center. Tampa has depth and goaltending concerns (Vasi was a sub-.900 SV% goalie for most of the year). Toronto has Toronto concerns. Florida is very well built, but has been struggling lately.
Will we see articles about those teams? Likely not. Apparently having elite special teams and goaltending is only a problem for the Rangers. Lest we forget how some folks bet big against the Rangers and lost a ton of money in the 2021-2022 playoffs. Lesson learned? Apparently not.
The moral of the story: Ask why. Or ask people that write about the team. We will be honest with you. The Rangers can win the Cup because the metrics post deadline are good and they have one of the best combinations of goaltending and finishing talent in the NHL. They can also lose because they can become to reliant on that skill, ignoring their system and process on a game by game basis.
More About:Analysis