Over the course of the last few months I have been attempting to develop a tool that would add another layer in a person’s ability to analyze a player. Today I am proud to launch the Player Salary Analysis Module, or PSAM for short, which compares production to salary for all NHL players. The tool is available on the menu above. Forwards can be viewed here. Defensemen can be viewed here.
We as hockey fans know of the different methods we use to evalute players. We have the traditional goals/assists/points in conjunction with scouting the player. We also have the new visuals that have been getting developed by members of the analytics community that help us as fans see how a player’s underlying stats classify his role or usefulness to a team, such as the famous HERO Charts.
There has been one thing that I feel hasn’t really been touched upon though. Along with the hard stats that we as hockey fans know and the underlying stats that have been developed, there is one more thing that helps us articulate the overall value of a player. Ever since the lockout of the 2004-2005 season, it may be one of the more important aspects of a player: His salary.
To begin, when I was younger (well younger than I am now), I dreamed of working within hockey operations, since I was a pessimistic child and never believed that I would make it into the NHL. One fateful encounter with current NHL agent Todd Diamond when I was 12 inspired me to really begin to look into different ways to evaluate a player and NHL teams. Being a Ranger fan and plagued by the contracts of Wade Redden and Chris Drury, which prevented them from making other moves, I was absolutely baffled to see how all of these previous Stanley Cup teams were built while the Rangers remained well fairly stagnant. A playoff team, but stagnant.
I decided to try to analyze every little aspect about the last few Stanley Cup champions and then began to wonder how much they allocate for their second line or how much they allocate for this depth winger that recorded 15 goals. As I began doing this for every team for the next few seasons I noticed that simple cap hits mean nothing when trying to potentially forecast a good deal or a right monetary move to make because the salary cap was always changing, A $4 million in the 2008 season is worth a lot more than $4 million now.
To put it into perspective, one of my favorite players growing up was Ray Whitney. He had 83, 61, and 77 points through the 2007, 2008, and 2009 seasons, respectively. All while making $3.5 million. If you have the opportunity to sign a 70 point guy for $3.5 million in the NHL today, you would never decline it. But in reality, Whitney’s deal was worth 6.3% of the $56 million salary cap, which when applied to this modern NHL is around $4.5 million. Still a steal of a contract for 70 points, but obviously not the same.
I then decided to try to think of a way where we can possibly analyze whether a player is worth a certain contract by using the percentage of the salary cap taken. At first I got nowhere, but after a year off of looking I decided that it may be valuable to compare a player and his salary to every player making a similar amount of money. It proved to be very difficult to compare one player to possibly 20 or 30 guys at once, so I decided to make a benchmark that represented the average stats of every player within a cap percentage range. This gave me an easy method of compare players in the same price range and evaluate those succeeding or underachieving. Whether or not a player is at the average of this cap range, succeeding or underachieving, at the end of the day he is still taking up that amount of money. I felt that it only makes sense to compare him to his closest peers so we can try to understand if a right move was made.
The Player Salary Analysis Module (PSAM) is a tool that I hope will add this kind of analysis to both the fans and those in management.I have a personal motto, “Never decline any form of information and always look to expand your understanding of something.” This tool is fitting for my motto, and serves many purposes that I hope will have great value to the hockey community:
- First things first, PSAM allows you to compare a player to his salary peers. To use the tool, go to the dropdown menu and choose any player you wish. He will appear on the visual. Along the top you will see a section labeled “Cap %”. The options range from < 1% to > 11%. You can then choose the cap range of the player you are evaluating from the same drop down. For example, if the player takes up 4.35% of the salary cap, you can choose the range “4%-4.99%” which will then compare your player to the average stats of every player making between that cap percentage. In the example below, Mats Zuccarello made $3.5 million (5.07%) of the cap last season. This is how he compared to others in that salary range.
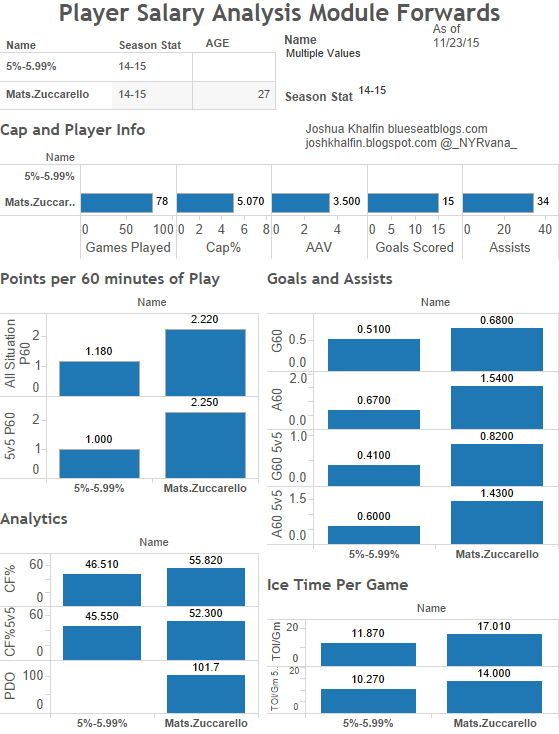
Last season, Mats Zuccarello took up around 5% of the cap, here is him compared to other players taking up a similar amount
- Another option is to compare your player to a theoretical contract, generally done with pending free agents and finding market value. To do this you once again click on your player of interest, but choose any cap percentage range that would fit the theoretical contract you would want to give that player. Lets again use Zuccarello as an example. He signed a $4.5 million deal last season. Prior to his incredible play this season some were wondering if he would be worth it. PSAM provides the ability to examine this contract independent of this year’s stats. At $4.5 million, he takes up 6.3% of the salary cap.
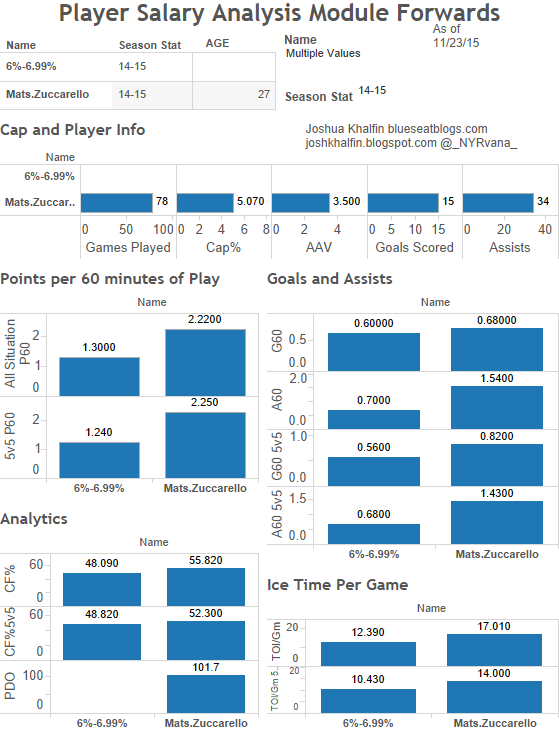
Even last year Zuccarello blows his new contract and his peers out of the water
- One important thing in the salary cap era is proper replacement and striving to find a bargain contract. For this you can take a pending UFA and once again compare him to many different cap ranges to try to find the optimal contract. Tomas Fleischmann of the Habs is a pretty nice example of this. A former talented scorer who was making a lot of money and who went through the summer without a deal. The Habs decided to give him a tryout. Let’s see Fleischmann compared to some of the lower cap ranges.
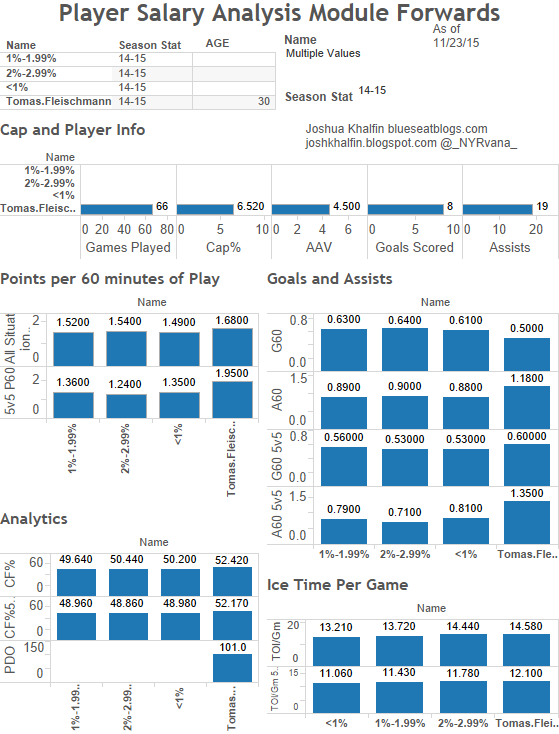
Fleischmann compared to the <1%, 1-1.99%, and 2-2.99% cap ranges
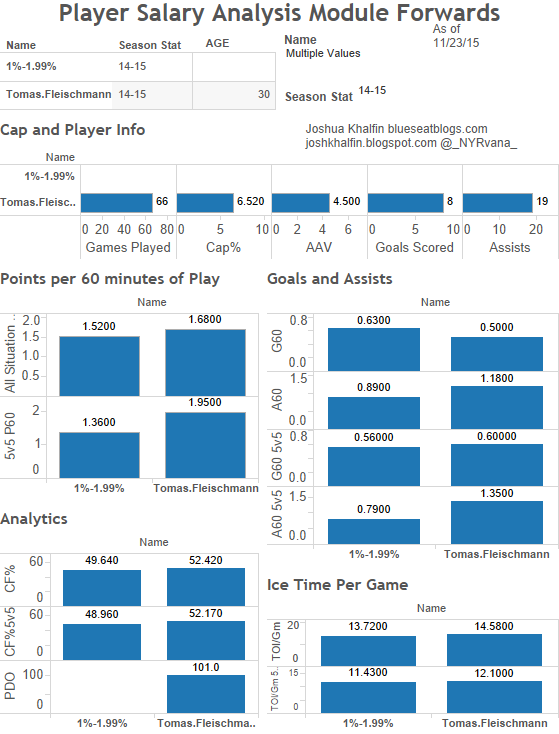
- For the most part Fleischmann out classes the average players in these ranges, so it would have been wise for the Habs to sign him to a deal within this range. Low and behold they signed him to a $750K deal, which is just over 1% of the salary cap. Below is how he looks compared to the 1%-1.99% cap range. In case you are interested, Fleischmann has 7 goals and 8 assists through 22 games this season.
- Finally, you may also compare two players for the purpose of replacement. Teams often find themselves in the unfavorable position of moving players they’d prefer to keep due to cap hits. Rangers fans know that all too well, as fan favorite Carl Hagelin was shipped to the Ducks. In turn, the Rangers signed Viktor Stalberg to a $1.1 million dollar deal to play Hagelin’s role, while Hags ended up earning $4 million in Anaheim. Using last year’s numbers, PSAM can show us if Stalberg’s production was a viable replacement for Hags.
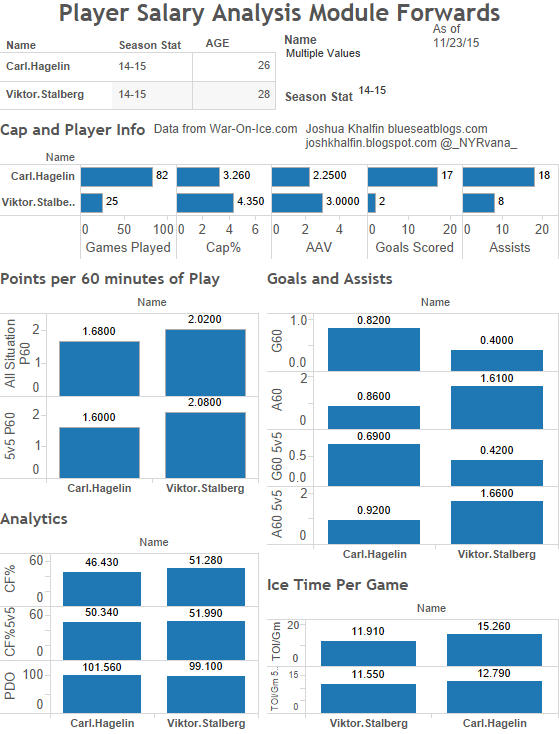
Hagelin vs Stalberg, 2014-2015
- Clearly last season Hagelin outplayed Stalberg in the goal department but pretty much everything else was in Stalberg’s favor. For one-quarter of the price it was probably worth the risk to sign Stalberg to replace Hagelin. Adjusting PSAM for this year’s stats, we can see how they are living up to their deals this season.
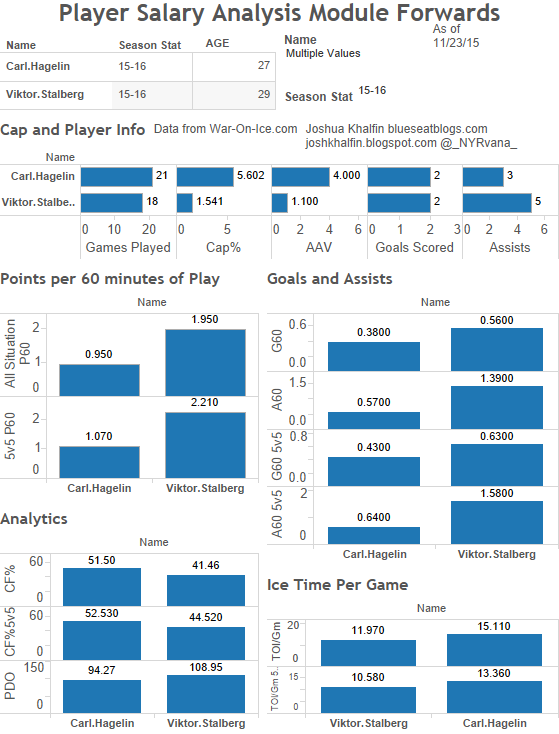
Hagelin vs Stalberg, 2015-2016
Other features will be added, such as a three-year trend to see how the player has been performing over time. I also hope to figure out a way to incorporate a similar tool that I have made for the prospect trends, so stay tuned.
It is worth noting that the stats don’t mean everything, there is always incredible value in scouting as part of your overall analysis. I also want to say that this does not discredit where a player blocks shots, hits, etc. Those are all still parts of hockey which coaches around the league stress, so it’s only right to consider them within the salary analysis. What I hope is that this tool puts it in perspective. In the end the points win the games ,so production should be the main factor in deciding market value. You then factor in all of these intangibles, like blocked shots and hits, and things gathered from scouting.
The purpose in finding market value is to eliminate emotion from the business. This prevents a team from getting into a situation where a heart and soul guy is simply outclassed offensively by his peers. It puts unfair expectations on the guy, which will only lead to more issues when trying to make other roster moves. These things are important, but this tool is designed to help avoid the situation where a team ends up paying someone $1.5 million more than they deserve. The NHL is a business and teams have to try to be efficient. In the end, these visuals just serve to give you all the information in one place and another way to analyze it, what you choose to do with it is entirely up to you.
Please email me (joshkhalfin [at]gmail[dot]com) if you have suggestions or identified an issue. Thank you for everyone’s support, from the ones who tried the original models to those who gave me an outside look on things to change a few things up. I truly appreciate it.
More About:Administrative Stuff