The Rangers are probably the most hotly debated 10-2-2 team that I’ve ever come across. There are those that believe the Rangers are the best team in the league. There are others that believe the Rangers are a product of unsustainable goaltending and shooting percentage. The reality likely falls in the middle.
The Rangers are probably one of the deepest teams in the league at forward. They have four lines that can score and play two-way hockey. They can skate, score, and play defense. Their rush-based offense has again turned turnovers into scoring chances and goals. The goaltending is elite, not much else to say there. The biggest questions are on the blue line, and it’s something we’ve covered here a bunch of times.
I looked at the Rangers’ numbers four games ago, and not much else has happened to really sway me from my opinion. The Rangers are not the best puck possession team, but the worries that the Rangers are one of the worst are overblown. Yes, the Rangers own a CF% of 46.5, which is ahead of only Colorado (terrible) and Detroit (probably bad). But the Rangers are really skewed by a few pretty terrible games.
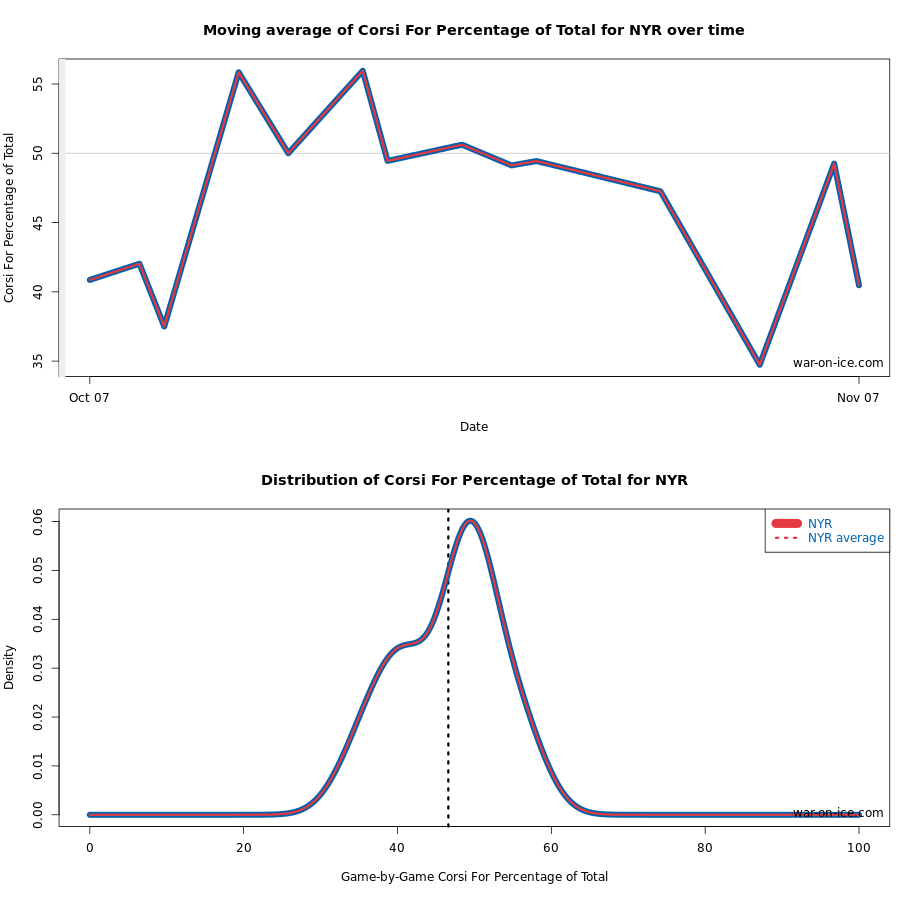
Courtesy of war-on-ice
The above chart is 5v5, all score situations. The Rangers have five games with sub-45% shot attempt distributions, and those skew the averages significantly. But they only have four games at 50% or higher. Most of their games sit in the 49%-50% range.
But here’s the problem: The Rangers have led for most of these 14 games, sometimes by wide margins. Score effects play a role, especially with that shell. The Rangers jump from a season average of 46.5% to 48.4% with an adjustment for score. That two-percent jump moves them from 28th in the league to 22nd in the league. The game-by-game breakdown doesn’t look much different, but there are subtle differences that mean much more.
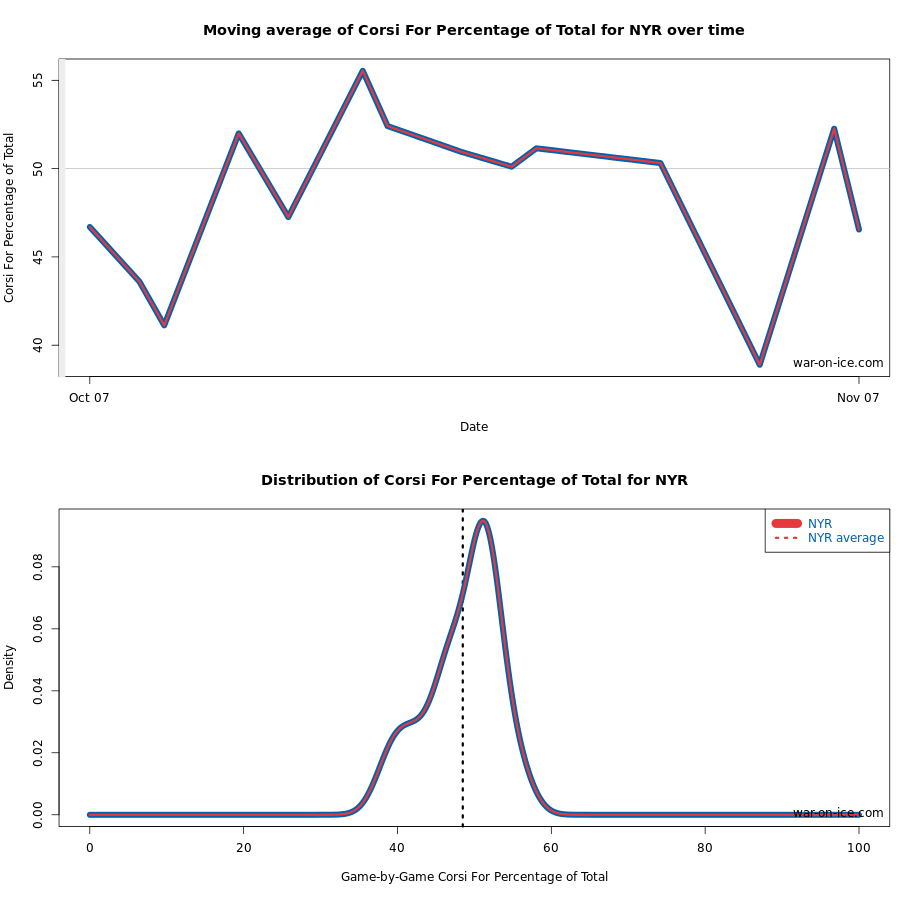
Courtesy of war-on-ice
The Rangers now have just three games that fall under the 45% shot differential mark. More importantly, they have eight games that are at 50% or better. Those three under 45% skew the average even more. From this, you can logically conclude that the Rangers might be a bit better than their possession numbers indicate. They aren’t perfect, but they aren’t a tire fire.
PDO (shot percentage + save percentage) is what gets a lot of people up in arms, especially when coupled with the possession numbers. Long story short, poor possession and high PDO means smoke and mirrors. It means a team is relying on unusually high shot percentage or unusually elite goaltending.
The Rangers have a PDO of 106.4, where league average is usually around 100. Simply put, the 106.4 PDO is completely unsustainable. The Rangers will not continue to shoot at 10.1% at even strength, and will not continue to make saves at a 96.3% clip. Neither are sustainable, and there will be a regression.
That said, PDO doesn’t necessarily account for elite goaltending. The league average of 100 is generally a 92.5% SV% and a 7.5% SH%, more or less. If league average for goaltending is 93%, then the Henrik Lundqvist factor probably moves them up to around 93% or 93.5%. That’s where they’ve sat the last three seasons. With that in mind, a 101 or 101.5 PDO (assuming the 7.5% shot percentage) doesn’t mean lucky, it means elite goaltending.
The shooting percentage will come down, as will the goaltending to a degree. But the Rangers are not the smoke-and-mirrors team that they are being made out to be. There are flaws, and they will hit some rough patches once regression kicks in. But this is a very good team that will make the playoffs.
More About:Analysis