Big thank you to @ChartingHockey and his wonderful chartinghockey.ca.
For some inexplicable reason, Henrik Lundqvist has drawn the ire of a small yet loud subset of the fan base. The only legitimate arguments being thrown out are that he’s 38, he had a down year last season, and there are kids waiting in the wings. All legitimate points, but this is the same crowd that is ok playing Brendan Smith on the third line because there’s no point in rushing the kids. You can’t have your cake and eat it too.
This small yet loud sect of fans saw themselves validated when Larry Brooks said that Alex Georgiev has outplayed Henrik Lundqvist this season. This came the day after the Rangers downed the Lightning in a very strong game all around, and Georgiev had a very good game. But let’s break down what Brooks stated.
Looking at the raw save percentage numbers, Hank has a .906 SV% and Georgiev a .924 SV%. They’ve more or less been alternating starts, so the sample size is still small for both of them. But sure, based off save percentage, Georgiev certainly has the advantage. But as everyone who shouts not all shot attempts are created equal, not all saves are created equal. Workload and quality against matters.
First things first, we can check the expected goals against per 60 minutes (xGA/60) for each goalie, as a way of analyzing the quality of shots each goalie has been facing. Hank checks in at a whopping 3.5 xGA/60, by far the highest in the league. Georgiev has a 2.3 xGA/60. Aside from this meaning that the Rangers are relatively bad on defense, they are worse when Hank is in net. Far worse. Hank faces the highest quality of shot in the league, and it really isn’t close.
There are stats that take this quality into account, basically Goals Saved Above Average (GSAA) and Goals Saved Above Expectation (GSAx, also available in a per 60 minutes stat). These stats are aimed at taking raw save percentage and using quality of shots against to better evaluate goaltending.
Both Hank and Georgiev have a 0.1 GSAA. This is a counting stat that is dependent on TOI, so this will get bigger for both goalies over time. They also split time at roughly 50/50, so they will never be with the league leaders. Hank carries a 1.3 GSAx, while Georgiev has a -1.4 GSAx. This suggests that Hank is actually performing better when taking quality into account. Using GSA/60, Hank is at a 0.3 and Georgiev a -0.4. That’s almost a full goal difference in performance versus quality. This suggests that if Georgiev faced the same quality of shots as Hank, he’d fare much, much worse.
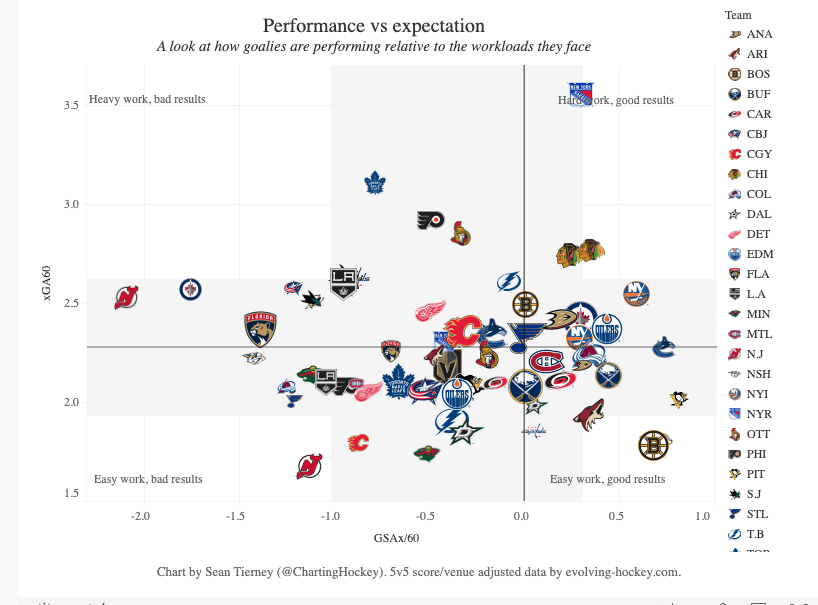
Comparing this to the rest of the league, that’s Hank all the way at the top. There is literally no goalie within miles of his performance in relation to expectations from a quality of shots standpoint. It’s fascinating, actually, to see how well Hank has played this season. If this team had any semblance of team defense, then this conversation wouldn’t be happening.
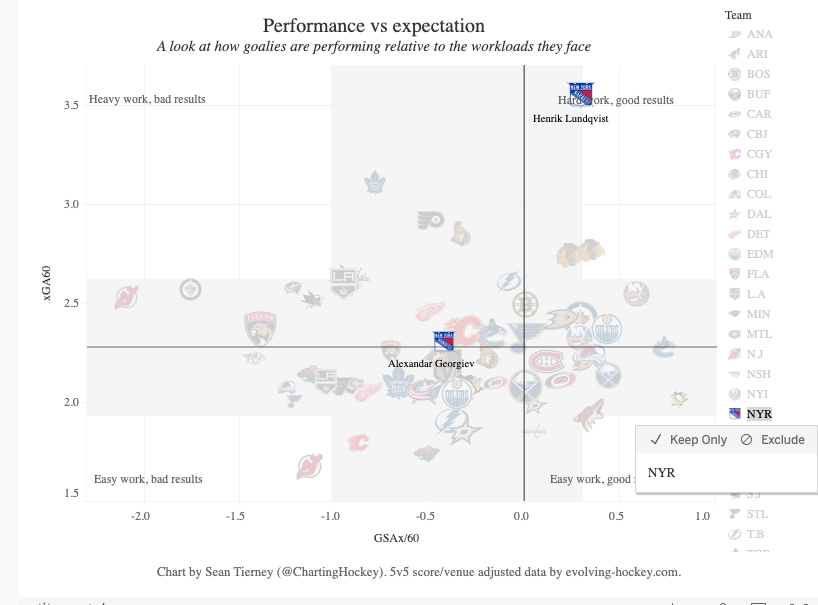
Comparing Hank to Georgiev, we see Georgiev unfortunately firmly in the “bad results” side of the chart. This doesn’t necessarily mean Georgiev is bad, since he was great last season by all of these stats. It just means he has had a slower start to the season, relative to the shot quality he’s faced.
GSAA and xGSA have great value, but there’s more to this than just numbers. Just like how we expanded on SV%, we need to expand on GSAA and xGSA. Luckily the NHL keeps track of shot type and shot location for every single NHL game. We can use this to see where all the shots against Hank and Georgiev are coming from. This complements everything we’ve see so far above.
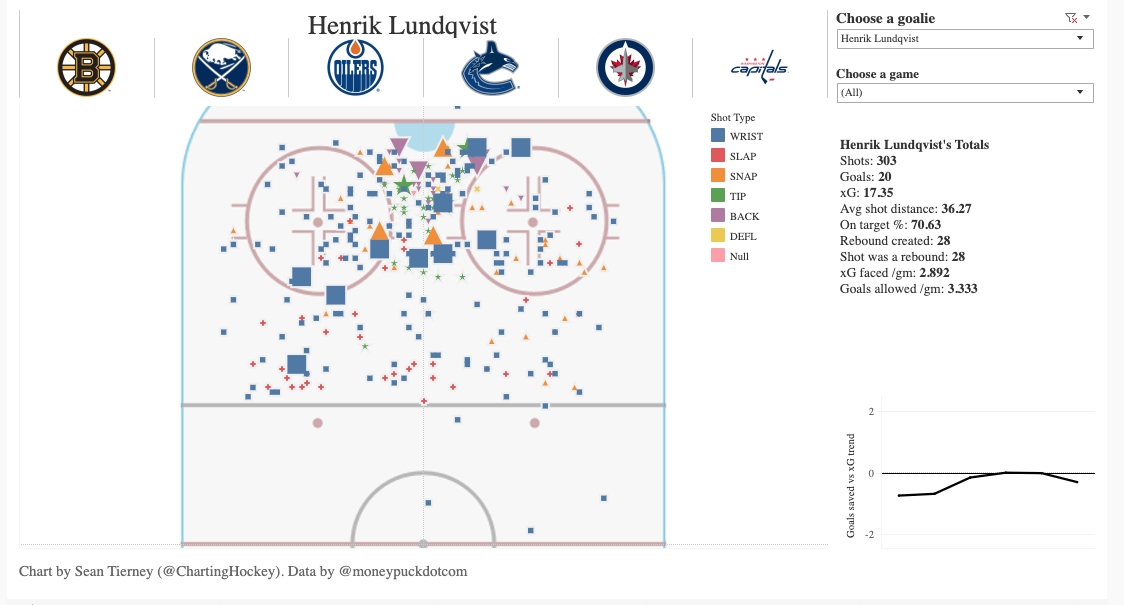
There is A LOT going on here. The easy stuff is the shot heatmap and type of shot from the plot on the left. The larger shapes are goals, the smaller shapes are saves, all color coded to shot type. For Hank most of the goals are from the high slot or in closer. There are three outliers here from the top of the left circle and further out. Those three can qualify as bad goals against.
The pane on the right shows the raw stats. Hank has allowed 20 goals at even strength compared to an expected goals of 17.35. The average shot distance faced is the key point here, and that’s 36.27 feet. That little line chart in the bottom right is a five game rolling average. Hank started slow but has gotten better over the last few games, Boston notwithstanding.
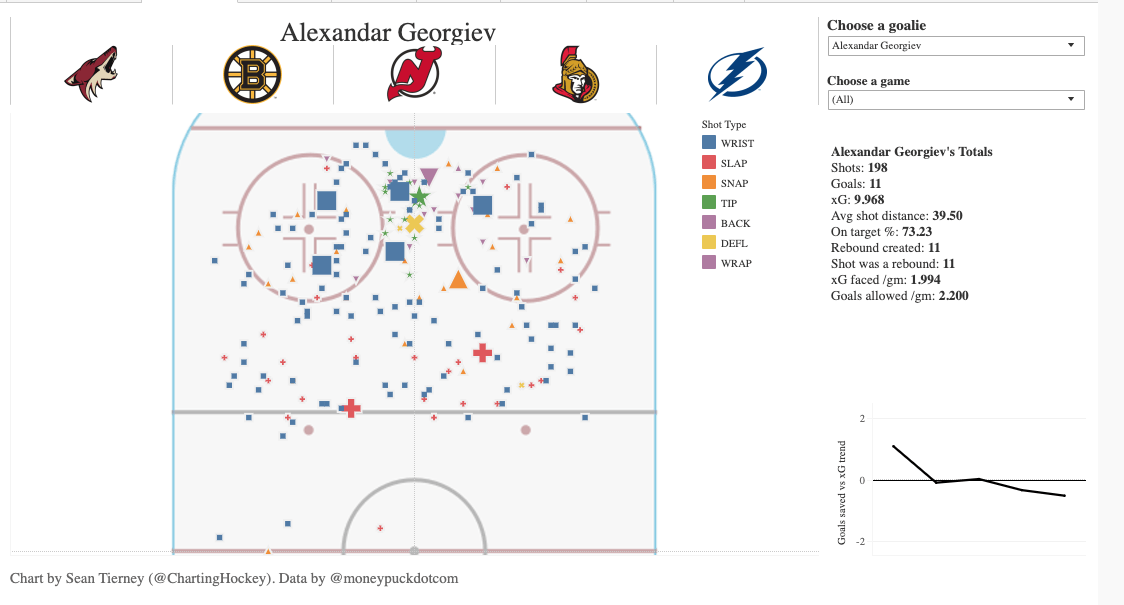
Now we check in on Georgiev. Notice two things here: The number of shots in front is significantly less cluttered. Also the average shot distance is 39.5 feet, almost three full feet further away than Hank. His xG faced per game is a full goal less than Hank’s, as is his actual goals allowed per game. Also worth noting that Georgiev has started off strong, but leveled off recently.
The question at hand is simple. Is Georgiev outplaying Hank?
If you look solely at SV%, then sure. However if you take a deeper dive and account for quality of shots against, then the answer is clearly no. Hank has worked borderline miracles with the workload he’s faced. Georgiev is a solid goalie, but he hasn’t outperformed Hank yet this season.
The better question is significantly harder to answer. Why do the Rangers allow so much quality against when it’s Hank in net, as opposed to Georgiev? Well that folks, is a post for another day.
Share:
More About:Analysis