
Last summer, I was asked to provide some insight into which stats I use, how I use them, and why I use them. I held off on writing that post until now for a few reasons, most importantly being my personal use of the stats available. This is going to be a very long post about how I use stats, why I use them, and how my use of them evolved over time.
First things first, I am not a statistician. For the most part, I do not understand a lot of the stat posts I see that dive into r-squared calculations. I read the first paragraph, I skim through the meat –which is where these posts begin to lose me– and then I read the conclusion. I also read what the trusted minds say about these pieces, and I draw my conclusions from there. But generally speaking, the “mainstream” stats have been peer reviewed multiple times. In any field, from math to medical to business, peer review is essential, which is why these are the ones that hit mainstream.
Why/How I use stats
I think this is a good place to begin. When I first began blogging in 2008, I had no insight into stats other than what I saw on the stat sheet. It wasn’t until the 2013-2014 season when I started to understand what Corsi was and why it was important, and how deployment –quality of teammates, quality of competition, zone starts– was important. The more I read, the more I used it in my posts. The more I used it, the deeper the dive I took into the stats as a critical analysis tool.
Sometime during the 2014-2015 season, I had hit the point where I was using stats for roughly 80-90% of my analysis. Generally speaking, the conclusions weren’t too far off from accurate, but it wasn’t the right approach for me. I started tying systems into my player analysis, and how each player’s skill set fit into a system. From a Rangers perspective, this meant focusing on the guys who could skate and keep up with a difficult hybrid man/zone defensive zone system. After identifying those players with that skill set, then I would look at the stats to see if my eyes matched the data. It wasn’t until I saw how far off I was with Marc Staal that I realized I was on to something.
A little backstory on Staal: I am still an unabashed Staal fan. I thought he was truly the next great Rangers defenseman, and there’s a good chance he could have been if not for injuries. His poor play was masked by Anton Stralman. And it wasn’t until Dan Boyle started to fade that his deficiencies, the ones on paper I ignored prior, started to show for my eyes to see.
Fast forward to today, and we have so much more available. For players that I watch regularly, I follow the above style of matching what I watch regularly to what I see on paper. If my eyes don’t match what I see on paper, I trust the paper and try to see where I was wrong. Using Staal as the example here, I spent more time focusing on him, and realizing that while still a good skater, he couldn’t pass the puck in a manner that warrants his ice time or salary. It’s a tough pill to swallow, that the paper knows more than your eyes, but it’s true when you use the paper correctly.
One last aspect that is absolutely critical is that these are all generalizations. There are exceptions to the “rules,” or outliers as they are called in stats. There are no absolute statements. These tools are used to evaluate the lower 90% of players to get an edge, not the upper 10% that are the elite players in the league.
The stats I use
Corsi
Perhaps the biggest misconception with stats, specifically Corsi, is that many think it is the one stat that tells you if a player is good or bad – that the stat is comparable to WAR in baseball.
Corsi is not WAR. It’s not even close. Corsi should not be used on its own as an evaluation tool. Any stats person who shouts Corsi at you without stating anything else is doing it wrong. Corsi is a tool to be used in conjunction with deployment, effect on teammates, points, and rate stats (per 60 minutes of play stats). But what exactly is Corsi, and why does it matter?
Corsi is a registered shot attempt (on net, post, missed, blocked) for your team or against your team while you are on the ice. If your team takes more shot attempts while you’re on the ice, then you have the puck more, and you could be a reason why your team has the puck. The opposite is also true. The best players in the league are those that register many shot attempts for while limiting shot attempts against.
For forwards, this is pretty straight forward. You want a player that has the puck a lot and drives these attempts. As Wayne Gretzky said, you can’t score on 100% of the shots you don’t take. There are nuances for sure, and not all shots are created equal, but as long as you have the puck, the other team can’t score and you will generate more quality chances.
For defense, it’s a little tricky. The game has evolved from the two roles of offensive defenseman and shutdown defenseman. The guys perceived as shutdown defensemen are viewed that way because they block shots and deliver hits. However if you are doing these while on the ice, you don’t have the puck. That’s not to say there isn’t value in blocking shots and delivering timely hits. They are a skill set that every team needs. However it is not the best evaluation of a defenseman in today’s NHL. You want players that can block shots and deliver hits as a complement to other skills, not as their primary skill.
That’s where CF (Corsi-For) and CA (Corsi-Against) come into play. It helps you split your paper evaluation of defensemen into two segments: Does he push offense, and does he stifle the opposition? The critical piece here is realizing that CF and CA numbers are the result of smaller plays that many say the stat doesn’t evaluate. Such plays that actually show up in CF/CA:
- Gap control
- Going to the corner for a loose puck
- Tying someone up along the boards, and kicking the puck to a teammate
- That first pass from behind the net to a teammate at the half boards to start the rush
- A good stick check to break up a play at the blue line
- An active stick in a passing lane
- Using the body to protect the puck
I’m sure I missed some, but these are the plays that I see in my mentions on Twitter as being the flaws of Corsi. It’s actually the opposite. These plays are Hockey 101 plays, and while there is no direct stat for each one, they are all inputs into CF/CA. Players with good CF/CA generally make these kinds of plays.
The interesting part here is that in today’s NHL, the same skill sets are required universally to survive in this league. Quick feet, good skating, good hockey IQ, quick hands, good vision, and solid passing. Skills and Corsi are not mutually exclusive.
Scoring Chances
Scoring chances are just like Corsi, except these are chances –missed, blocked, posts, on net– that are defined by distance from net and type of play. Same concepts above apply, just for a better quality chance.
You expect your better forwards to have better scoring-chance-for (SCF) numbers. You expect your best defensemen to have great scoring-chance-against (SCA) numbers.
High Danger Scoring Chances
Another type of scoring chance, but these are generally your point blank shots. Same concepts above apply.
Deployment
Deployment is a critical aspect of talent evaluation, and where things start to get a little tricky. As mentioned above, using Corsi on its own is flawed. There needs to be an understanding of how a player is used to get a full understanding of the numbers. Is a player being dragged down by defensive zone starts and playing against the best quality competition? Is a player being dragged down by bad linemates?
The basics of deployment are simple for forwards. The most skilled players get the most ice time in the offensive zone, and their numbers show. Those that are supposed to excel defensively are given defensive zone starts, with the job of limiting shot attempts –thus preventing quality chances and goals– and pushing the play up to the offensive zone, where the scorers can light the lamp. Every player has a role.
Measuring effectiveness in this role is where a lot of confusions lies. If a player is being deployed against top competition in the defensive zone, then he is expected to have good CA numbers. The logic is simple: He is being deployed this way because he limits shots and goals against. He uses all those little plays listed in the bullet points above to frustrate the opposition, force a turnover, push the play up the ice, and then get off the ice for the scorers. A good CA reflects all this, but they may not have a good CF. This is what you expect of players like Marc Staal, and Dan Girardi. And therein lies the critical aspect: Deployment doesn’t deliver results. Skill and effectiveness deliver results.
On the flip side, a good CF is expected from someone who is charged with driving offense, getting the puck to the net, and putting up points. This is what you expect of your guys like Keith Yandle, who will drive possession but may not limit shot attempts against. Yandle isn’t viewed as great in his own zone when pinned there, but once he gets the puck, it’s a calm and controlled zone exit to get the puck up the ice. Yandle has great CF numbers, but his CA numbers are average.
Now there is a specific subset of players that don’t put up points, but have great CF and CA numbers. Prior to signing with the Lightning, Anton Stralman was one of these players. When a player has great CF and CA numbers, he excels at the little things in the bullet point list above, but also excels at setting up his team for chances in the offensive zone. Theoretically with more playing time and the right deployment, these players deliver more points. This is especially true for Stralman.
Rate Stats
If you have two players that have similar skill sets, but Player A gets more ice time than Player B, then you expect Player A to have more points. It’s a relatively simple concept, but one that is often misconstrued. Sexy point totals are nice, but ice time can sway any point totals. Just look at Mikkel Boedker.
That’s why rate stats –goals, assist, and points per 60 minutes of ice time— are a better evaluation tool. It evens the playing field for players receiving top line minutes and those receiving third line minutes. With ice time equal you can start evaluating who is a passenger on a team benefiting from big minutes (Boedker), and who is playing beyond their role and may put up sexier numbers with more ice time (Kevin Hayes).
When you combine great CF/CA numbers with great rate stats, you get a potentially great player. Victor Hedman excels at everything listed in this post so far, and it’s clear he’s an elite defenseman. But this is where you can start seeing why players like Shea Weber may currently be viewed as slightly overrated and/or slipping in production from what he once was.
WOWYS – Effect on teammates
The last piece is the effect a player has on his own teammates. The good players are those that have positive impacts in shot attempts –both for and against– while on the ice. Again, all of the little plays mentioned above are accounted for in these numbers. The best teammate is someone who does all these little things effectively, thus creating more chances for and limiting chances against.
A player that goes to the corner, battles, and successfully gets the puck to his teammates is the ultimate teammate. He’s doing the little things to stop the opposition and transition to offense. This is the same type of player that can use his body to protect the puck and draw attention to himself in the offensive zone before dishing to a teammate for a look.
Systems matter – Relative stats
This is the piece that is missing from the majority of fans that use these stats regularly. Hockey is not a cookie cutter sport. What works for one player may not work for another. The most polarizing player for the Rangers is Dan Girardi, and for good reason. Under Tom Renney and John Tortorella, who played conservative defensive zone systems that focused on collapsing low, Girardi was the rock that solidified the defense. Under Alain Vigneault and his hybrid overload/man coverage system, Girardi’s faults were exposed from day one. Systems matter.
Without getting into a huge primer on systems (all laid out here, or just follow Prashanth Iyer), each coach plays a different system, and each system has a different effect on a player’s numbers. A player in a low zone collapse system is expected to have worse CA numbers than a player in a more aggressive overload or man coverage system.
Comparing players within the same system is difficult, but relative stats –comparing teammates to each other– help bridge that gap. These numbers are generally a positive or negative number. A player with positive relative stats compares favorably to his teammates, and may be a better fit for that system. Think of this as the new plus/minus.
Some of this is guesswork, which is where evaluating the skills of the player comes into play. Sticking with Girardi as the example, there’s a chance he may be a serviceable defenseman for a team that does not have a defensive zone system that relies so heavily on skating. A system that relies on shot blocking likely suits his skills better. However the opposite can likely be said for Anton Stralman, who is such a smooth skater that he can disrupt the rush and transition to offense seamlessly.
The tools – Putting it all together
There’s a lot to digest here, and looking at it all may be difficult to understand. Luckily there are some great minds that have made visuals instead of tables to put it all together for you.
First and foremost is Manny Perry (@MannyElk), who owns Corsica Hockey, the war-on-ice.com replacement. This is where you can view all the rate stats, how a player has progressed/regressed over time, and team stats. 99% of the people listed below use Corsica as the base for all their visuals. Manny’s corsica.hockey website is an invaluable resource.
Next is Domenic Galamini (@MimicoHero), who runs Own The Puck. This is where we get our HERO charts from. These charts evaluate one player or compares two players side by side. Here’s an example of how Shea Weber compares to P.K. Subban:
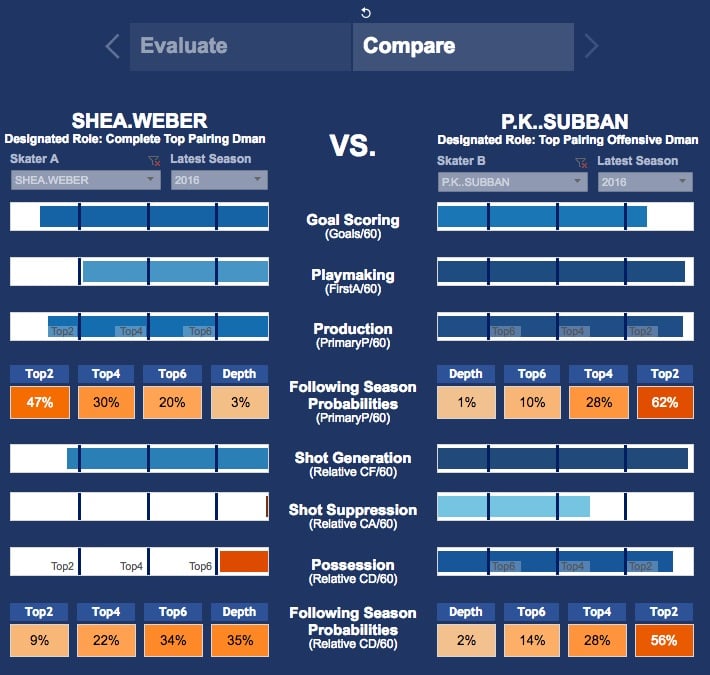
After reading the above, and then viewing this chart, it’s clear to see that Montreal didn’t get enough in return for Subban. It’s not that Weber is bad. He’s still an elite scorer and shot generator for his team. However he’s not the complete package. He appears to be fading quite terribly in his own end. Meanwhile Subban, four years younger, is the complete package. This is why the trade was laughed at.
Up next Micah Blake McCurdy (@IneffectiveMath), who runs hockeyviz.com. There are so many visuals available it’s incredible, but perhaps the best resource for me is the WOWY chart for each team.
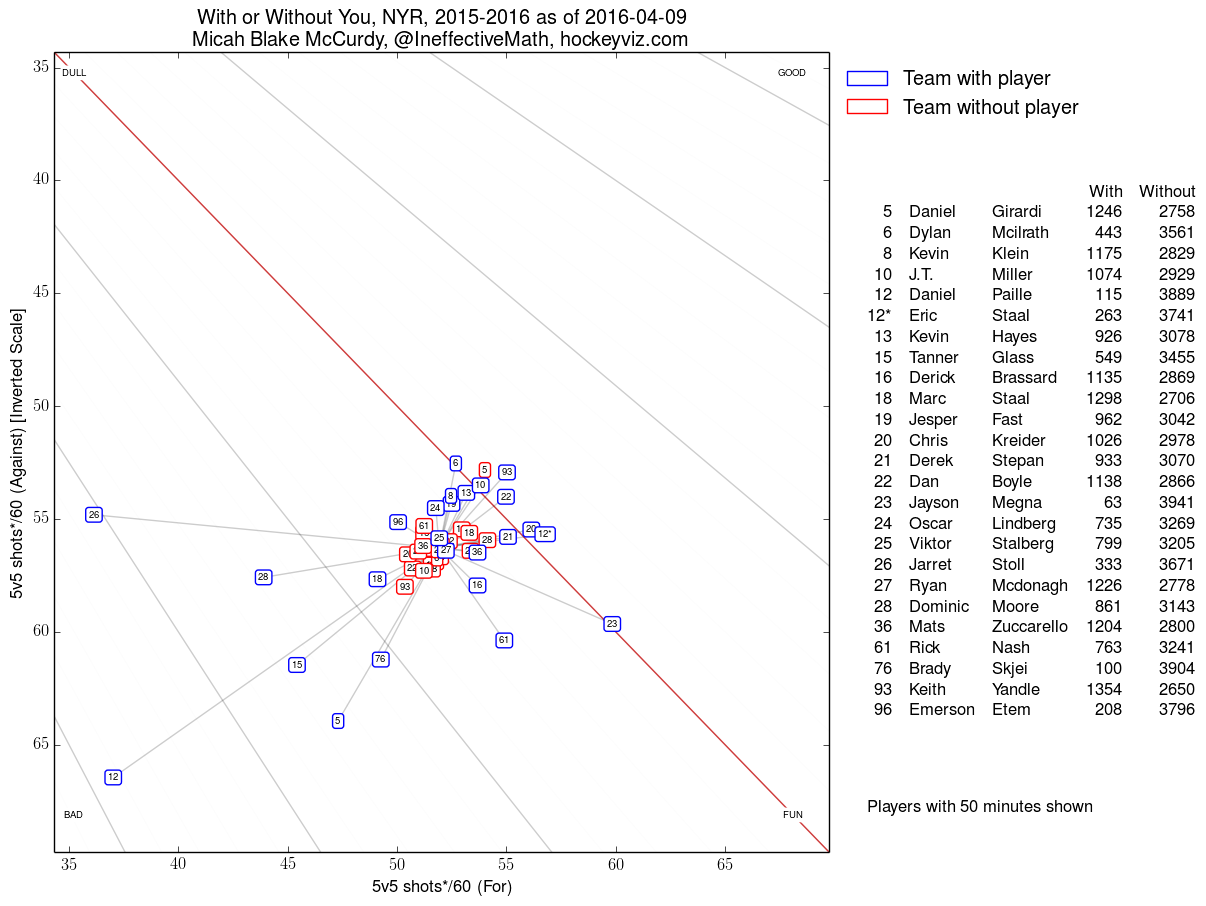
Click to enlarge
Everything is laid out with clear cut definitions. Good/bad sections are clearly marked. Blue and red sections for how that player effects the team are clearly marked. And this is just one level. Micah has these visuals for defense pairings and forward combinations as well. This really drives home the impact of a player on his teammates
Carolyn Wilke (@Classlicity), who manages Today’s Slap Shot, puts together charts like this one:
Last year NYR vs OTT pic.twitter.com/fupc2v66UT
— Carolyn Wilke (@Classlicity) July 18, 2016
Like Micah and Domenic, everything is clearly labeled, easy to read, and easy for us colorblind folks to follow. This is just one of the many charts she puts together, and then explains in later tweets. It really drives home the deployment and effectiveness of players. And she regularly tweets these for all 30 NHL teams.
Perhaps the best part about this quintet (Prashanth makes five) is that all five answer questions in a manner that is easy to understand. There are certainly more great minds than these five, but these are the five that I personally rely on. They have provided a wealth of knowledge in bridging the gap between the paper analysis, the systems analysis, the skill analysis, and then tying it all together to give a fair, objective scouting report for teams and players.
This is a 3,000 word answer to a question and request made of me last year. I hope that I have adequately answered the question, and helped drive more discussion about the game, the stats, the systems, and tying it all together. Let’s make hockey great again.
Share:
More About:Analysis