www.usatoday.com
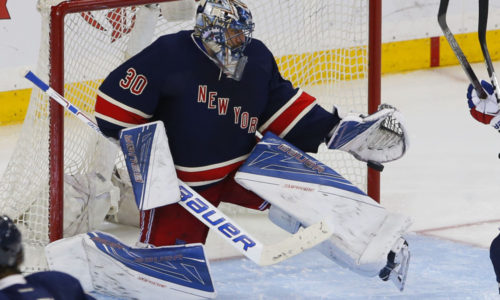
Henrik Lundqvist has been the backbone and the face of the New York Rangers for over a decade. It’s been a fascinating career to watch, as we have become somewhat jaded to his consistent excellence and the impact he has had on a franchise in transition, coming out of the lockout in 2005.
Now, at age 34, with a huge contract and still without that elusive Stanley Cup ring, detractors have begun to emerge and question The King’s right to his throne. Specifically, they have taken shots at his current performance level and anticipated decline.
If you have been a frequent visitor to Blue Seat Blogs, you are well aware that I do not agree with this analysis. Generational talents tend to age on a different curve than their colleagues. Dominik Hasek, for example, was highly effective into his forties. Honestly, at this point, I don’t even feel this is a relevant conversation to have. Contrary to some beliefs, Hank has not yet even begun to decline. He has spent his entire career buoying the talent level of the organization and that theme has persisted, even as the quality of the blue line has decreased over the last few years.
Before we get to the statistical performance, let’s talk about Hank from a scouting perspective. When you look at traditional goaltender decline, it is typical for agility, flexibility and footwork to be the first signs. Body coordination and skating ability tend to follow next. The interesting thing about Lundqvist is that there are indicators about his physical style that insulate him from typical symptoms of decline.
For starters, his crease depth helps mitigate agility related issues. Because he plays so much deeper than many of his contemporaries, he has less distance to travel when he pushes and slides laterally. The width of his stance creates an artificially large frame within the net, and the butterfly drop is aided as much by physics as it is technique.
Hank’s edge and footwork are the most important tools in his arsenal. He is able to cover a tremendous amount of lateral area, and as he ages, it would be the biggest contributor to his decline. The silver lining is that while he may lose some speed on his technique, the technique itself has proven highly effective and is mitigated further by his overall angular excellence and the aforementioned crease depth.
The most interesting thing about plotting Henrik’s trajectory is that he will likely be the first hyper-technical goalie to go through the process. Even goaltenders of a similar age group; Roberto Luongo, Ryan Miller and Pekka Rinne, rely far more on athleticism to make up for technical inefficiencies than Lundqvist does. He will really be a test case for seeing how this next generation of technical goaltending will age. So far, he hasn’t given us much reason to believe we are watching it, yet.
So, what about all those people who think he is declining? Do the statistics bear that out? Let’s take a look. It goes without saying at this point that advanced statistics for goaltenders are still in their relative infancy. For the purposes of this exercise we are going to cite GSAA (Goals Saved Above Average). Quick little primer: GSAA applies the league average save percentage to the total number of shots a goalie has faced. The resulting statistic is how many goals the goaltender saved above the league average based on their individual save percentage. For more information on the statistic, be sure to check out this wonderful article by InGoal Magazine’s Greg Balloch (@GregBalloch).
This statistic is far from perfect. However, it does a few things well. It excels in taking team out of the equation and normalizing goaltending performance, league wide. It is also a good indicator of how reliant a team is on their goaltender. Goaltenders who will routinely bail their teams out and mask defensive issues will generally have a higher GSAA. On the flip side, goalies who play more games tend to have artificially high GSAA. Additionally, it does not factor in penalty killing or shot quality. Most applications of the stat have begun to weed out special teams to minimize noise, but the original calculation did not.
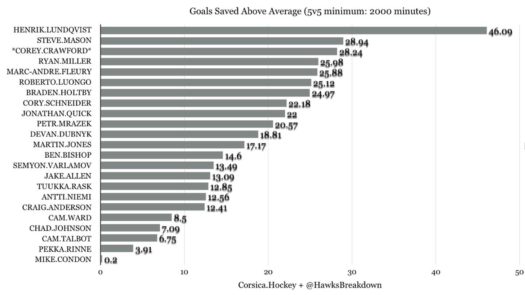
Check out this chart from @HawksBreakdown:
@Hawksbreakdown
When you look at Hank’s numbers for the 2015-2016 regular season, he was responsible for stopping a whopping 46.09 (!) goals above the league average. Considering some of the limitations within the statistic, you could probably account for some inflation due to Henrik’s 5th ranked games played (65, just three from Jon Quick’s league leading 68). However, since Lundqvist’s numbers almost double his closest compatriots in games played (Holtby, Dubnyk and Quick), he must be doing something right.
@HawksBreakdown
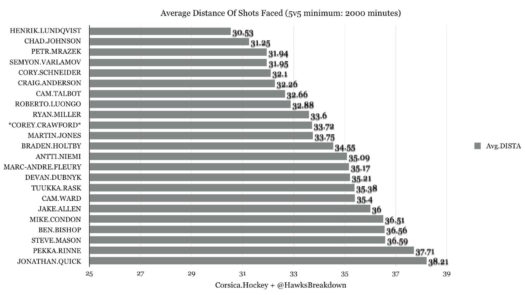
Shot quality data isn’t fully available in the aggregate, so we will need to break it down a little. First, we can start with shot distance. You can see from the chart above that Hank had the shortest average shot distance of any goalie in the NHL last season. This means that shooters were closer to Hank upon the release of their shots than they were against any other goaltender. Quite a bit of this can be attributed to the poorly executed defensive system that plagued the club for most of the season, but is also a testament to Henrik’s performance over the course of the year.
@imfleming16
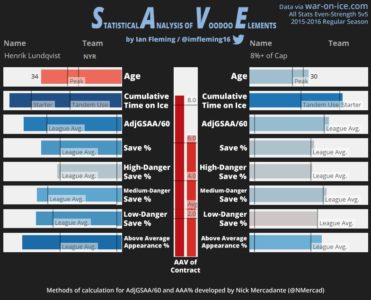
When you move onto specific shot types, Henrik acquits himself similarly well. As you can see from the chart above*, Lundqvist is comfortably above league average in every type of shot. The high danger shots are the sexiest type when gauging performance, but those shots are far more difficult and often times give the goalie a very small margin for error to come up with saves. What I actually find more impressive are the shot types and stats that indicate consistency. You can see that Hank impressively outpaces the league average in low and medium danger shots. This shows he is not prone to the soft goals that people seem to zero in on; on the rare occasion he gets beat.
*Created by the brilliant Ian Fleming (@imfleming16), SAVE charts are basically the goaltending equivalent of HERO charts and provide a phenomenal snapshot of goaltending performance.
Nick Mercandate (@NMercad) over at Blueshirt Banter has created his own stat, which is a variation on GSAA, called AdjGSAA/60. His methodology takes danger zones into account, normalizes the statistic to 60-minute intervals to account for more or less playing time, and removed special teams, so you can compare goalies as neutrally as possible. When examining Lundqvist’s performance in this regard, Hank is still well above league average.
While I am not a fan of more traditional rate stats, let’s look at that while we are at it. Despite all of the defensive turmoil and general questions about possible decline, Lundqvist’s 2015-2016 save percentage was .920, exactly .001 less than his career percentage of .921. I don’t think this is a valuable indicator of performance, however, you can see that is also supports a conclusion of quality play from this past season.
Now, let’s move onto the playoffs. This is generally when everything gets put under the microscope. I haven’t heard many people outright blame Hank for the Rangers’ early exit this year, but there have been plenty of grumblings that he wasn’t as good as he has been, or should be. Let’s break that down…
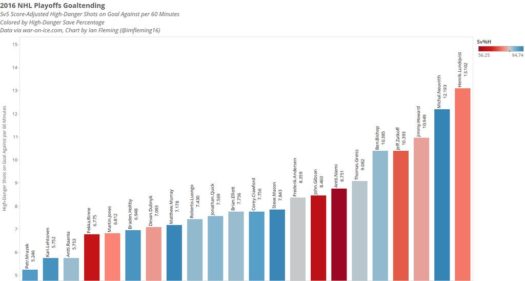
@imfleming16
When you look at the chart (also from Mr. Fleming), you can see that Hank faced the most frequent high danger shots of anyone in the playoffs. This passes the eye test, as well. Another fun stat from our friend @HockeyStatMiner is that since 2005 (when the stat began tracking) Hank has faced more high danger shots than low danger shots in the playoffs three (!) times. From a team perspective, that is not a recipe for success. There have been many issues with the Rangers in the playoffs, but Lundqvist has not been one of them.
But, Justin, he gets paid way more than any other goalie in the league, and we shouldn’t be allocating this much of the cap to him! It is true; Lundqvist is the highest paid goaltender in the NHL. If I can refer you back to the SAVE chart above, you can see Mr. Fleming compared Hank’s performance to goaltenders allocated 8% of their teams’ salary cap. Obviously, there are no direct comparables at Lundqvist’s salary range, because no one makes as much money as he does. As you can see above, Hank’s performance looks very favorable in light of an 8% allocation.
Let’s look at this, another way, though. If we refer back to GSAA as a basic benchmark for value, we can look at the direct cost per goal saved above average. Lundqvist, at $8.5 million per season, only cost the Rangers about $185.5k per GSAA. If you look at other top performing goaltenders from last season, Braden Holtby ($244.3k), Jon Quick ($263.6k), Corey Crawford ($207.3K) and Steve Mason ($141.6k), only Mason proved to be a better per goal value than Lundqvist. Mason is also a unique case in that his salary is artificially low versus his production ($4.1m cap hit) due to his complete collapse in performance when he left Columbus.
While Hank does take up a significant cap hit, the Rangers are still seeing a tremendous amount of performance value from their investment in him. You may have a personal feeling that this much money should not be tied up in a goaltender, and that is your prerogative. However, I find it very difficult to make the claim that Lundqvist is overpaid based on his performance, both from a statistical standpoint and from the eye test.
There are also those that think Hank is a trade chip the organization should cash in to help refill the prospect coffers. The problem there is goaltenders have an ugly, ugly history when it comes to trade value. Generally speaking, goaltenders are either developed or signed. When they are traded, the returns historically are grossly under representative of the goaltender’s talent level and value. The last big goalie trade of significance was the deal that sent Ryan Miller to St. Louis. At the time, almost every analyst believed the Blues paid a massive price for their upgrade between the pipes. When the dust settled, though, the Sabres ended up with two salary dumps, a good, but not great prospect, a low first round pick and a conditional third for their franchise icon and a capable bottom six player in Steve Ott. Would anyone take that return for Hank? I didn’t think so.
The loss to the eventual Cup champion Penguins this year was a tough pill to swallow. Many analysts saw the regression of the team’s play coming and were able to emotionally prepare for a reality in which this team simply wasn’t good enough to compete for the ultimate prize. It is only natural to look to blame something when things don’t go according to plan.
This was compounded when the new reality of roster construction challenged the value of many traditional skill sets and vaunted more modern ones. I’m not a psychologist, but I would opine that the insecurity of change has made resting on the old mainstream media narrative of “Hank hasn’t won a Cup in his career, he must not be a real winner”, much easier and more comfortable. I hope the article you just read helped put that ridiculous notion to rest (especially since the guy has an Olympic Gold Medal, a Vezina Trophy and about 1,000 All-Star Selections), and allow you to be able to full appreciate watching a future First Ballot Hall of Famer ply his craft in our own crease. I know I do.
Share:
More About:Analysis Goaltending