
My go to image for stats analysis.
For the past year, I’ve been theorizing that the Rangers may have a higher shooting percentage because most of their offense is based off turnovers and creating rushes. In theory it makes sense. The Rangers pressure teams in the neutral zone and high risk area between the defensive blue line and the top of the circle, force turnovers, and then transition to offense.
This type of game requires a specific skill set up and down the lineup. It requires positional awareness, speed, quick passing, and elite finishing. It also requires faith in goaltending, as any mistakes lead to scoring chances against. In theory, a team that executes this properly should have a higher shooting percentage, since rush chances are generally perceived as higher quality chances.
Emmanuel Perry of war-on-ice was kind enough to provide me with the data required to take this analysis to the next level. For this study, I performed two things at the team level:
- Took raw rush chance numbers and divided into raw Corsi-for, determining the percentage of rush chances. I’m going to call it RC% for the sake of this post. I then compared RC% to shooting percentage.
- Took raw scoring chance numbers and divided into raw Corsi-for, determining percentage of scoring chances. I’m calling that SC% for the sake of the post. I also compared SC% to SH%.
Side note: This is my first time doing something like this, so stat guys, please let me know if I did this properly.
Rush Chances
Before getting into this, a disclaimer: Rush chance definition is a bit off, since we need to base it off the data we have readily available to us. Hockey Analysis defines a rush shot as:
- A shot within X seconds of a shot attempt by the other team on the other net.
- A shot within X seconds of a face off at the other end or in the neutral zone.
- A shot within X seconds of a hit, giveaway or takeaway in the other end or the neutral zone.
It’s not perfect, since it omits turnovers in the high-risk area from the blue line to the top of the circle in the offensive zone. It also omits stretch passes that lead to rushes, chips past a pinching defenseman, and other smaller plays. I was provided the data above in four and eight second increments.
First using the four second increments, I plotted RC% vs. SH% using data from 2011-2012 through 2014-2015. There wasn’t enough data from this season yet. Here’s what the plot found:
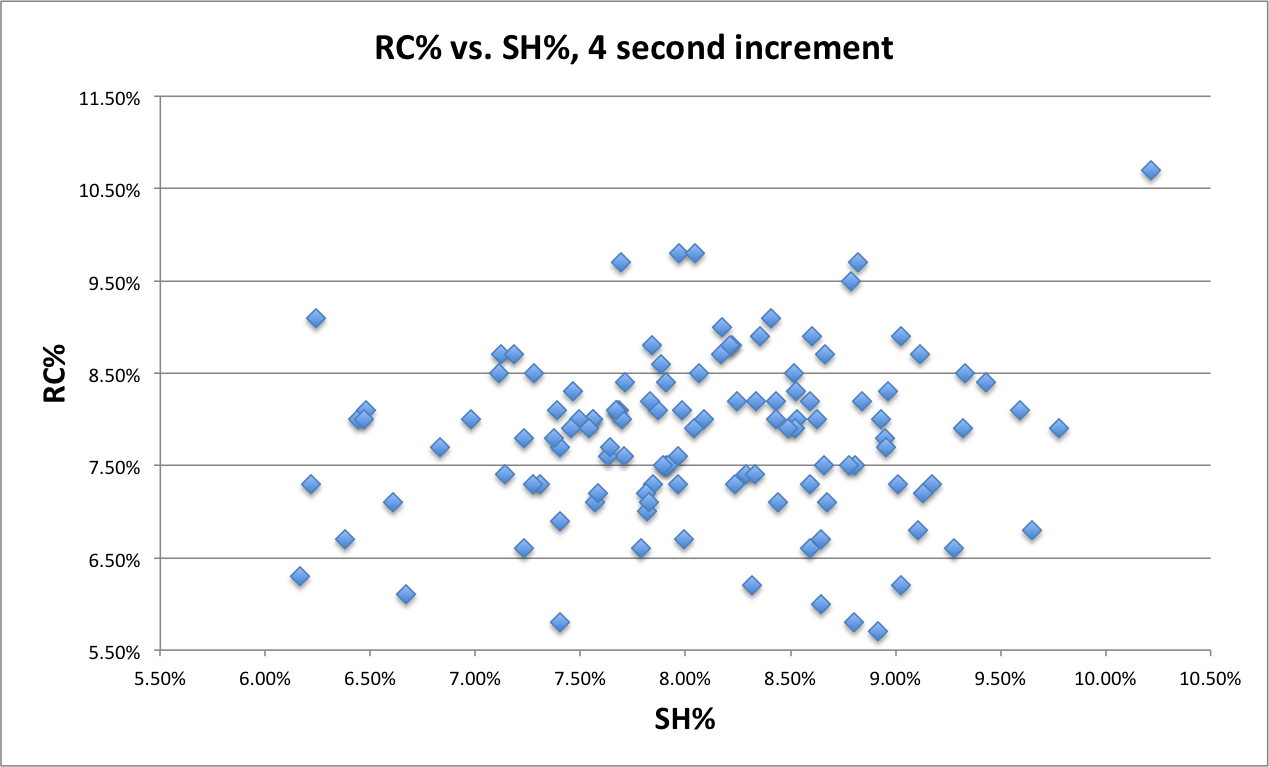
To put it mildly, there is absolutely no correlation between rush chances, as defined above within four seconds, and shooting percentage. The r-squared, which measures correlation, was .009. The closer to 0, the less correlation. The closer to 1, the more correlation.
I expanded this to eight seconds, and while there was a slightly better correlation (r-squared of .01), that’s not enough to base any conclusion.
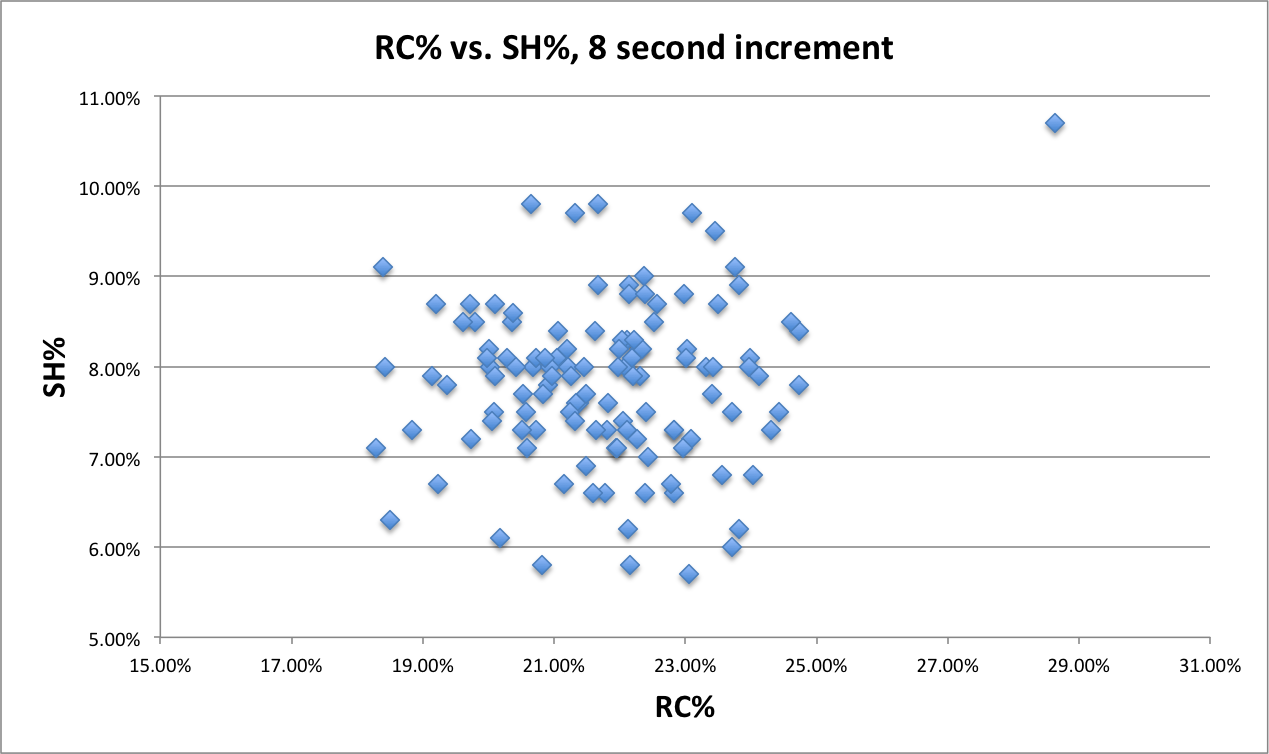
That one stray data point on the upper right corner? Toronto Maple Leafs in 2012-2013. Nothing really important, but was just funny.
Scoring Chances
Since rush chances did not yield my hopeful results, I expanded my criteria to all scoring chances, using the same method above for rush chances.
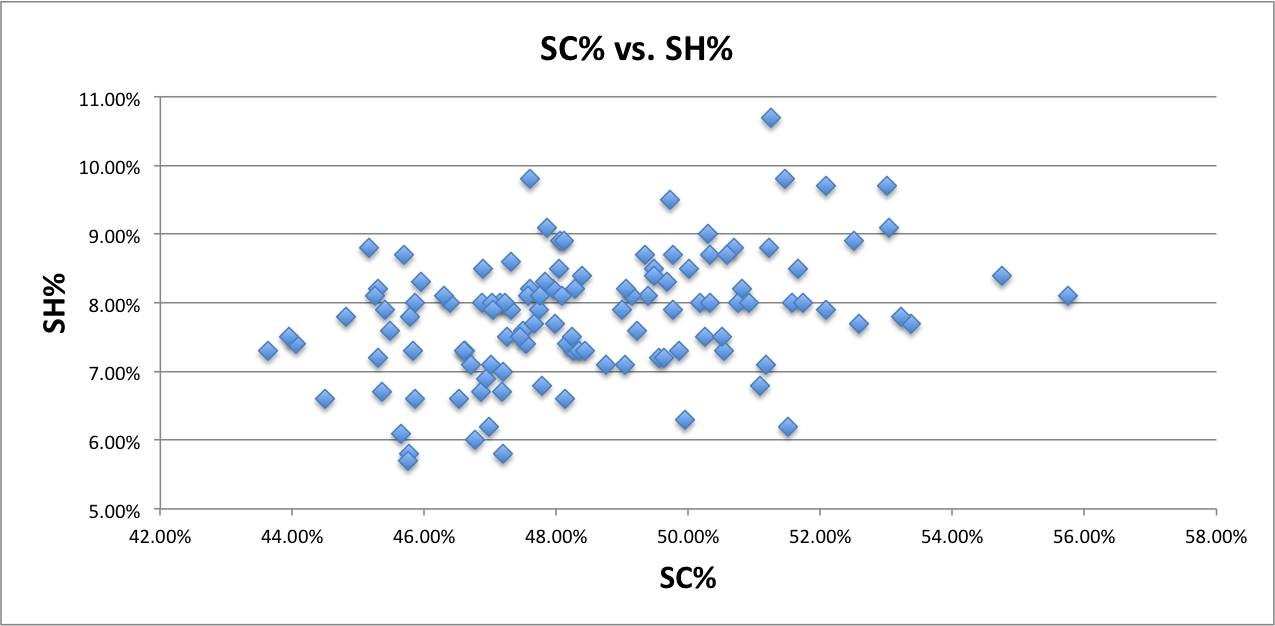
The r-squared here is .13, which shows significantly more correlation between scoring chances and shooting percentage than we saw with rush chances. That said, the correlation is still relatively small. But it did intrigue me enough to expand the sample through 2005-2006, which is the first year we have data like this available.
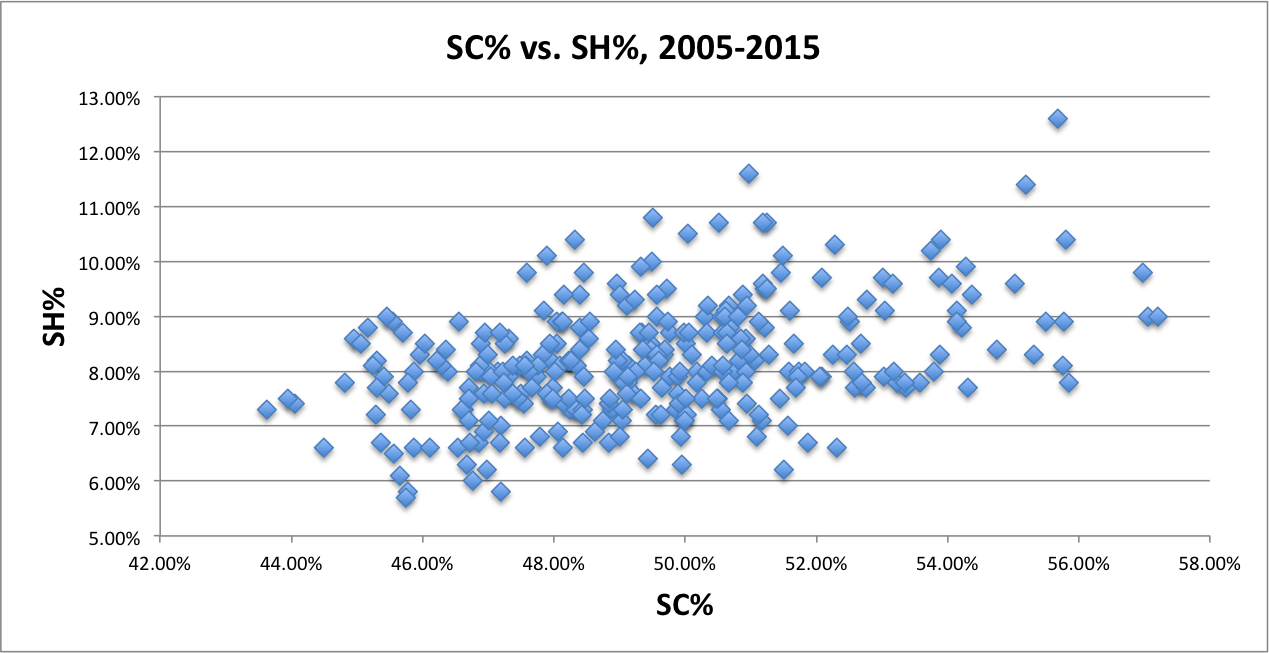
The r-squared here is .16, so we see the same similar relationship that we saw above. There is some relationship between scoring-chance percentage and shooting percentage. My guess is that there would be more correlation if we were presented with data from tracking chips and/or manual player tracking.
Conclusions
There are a few conclusions to draw from this (assuming I did this correctly):
- Based on the data we have available to us, there is zero correlation between rush chances and shooting percentage at the team level.
- There is some correlation between scoring chance percentage and shooting percentage at the team level. Teams that generate more quality chances will have more success when shooting. Seems fairly simple and straight forward, even for a small correlation.
I’m not sold that rush chances don’t correlate to shooting percentage, and that has to do with our current definitions of rush chances. However without player tracking, I don’t think we can get any closer to the true definition of a rush chance. Ideally I’d like to see rushes, as we have it above, include pinching fails and stretch passes, but I don’t think that’s possible with the real-time stats the NHL makes available. I believe we can only do that through manual tracking and/or tracking chips in sweaters.
I’d also like to see if we can drive a “scoring chance percentage” stat, since it at least gives us some insight into shot quality. I’d be interested to see if forechecking/defensive zone schemes play into scoring chance percentage (SC%). But like my initial work with defensive zone system/shot attempts against that wound up being inconclusive, we are bound by the data we have available to us.
Back to the drawing board.
Share:
More About:Analysis