As you know, we focus a lot around using both qualitative (eye test) and quantitative (#fancystats) analysis around here. Both have their pros and cons, and both should be used when evaluating talent and performance. These are not mutually exclusive measures.
One of the major drawbacks of #fancystats –specifically Corsi/Fenwick– is that it doesn’t measure the quality of the shot. While shot quality has been proven to be an unrepeatable skill, meaning we can’t quantify it at a statistical level, it doesn’t take away its importance. Luckily, the folks over at the indispensable war-on-ice have come to our aid with their scoring chance stat.
The Definition
Like Corsi/Fenwick, scoring chances —defined by WOI— calculate the number of scoring chances taken and allowed by a team while a player is on the ice. This is measured in raw scoring chance +/-, then converted to a percentage, much like we have with Corsi/Fenwick.
Their definition of scoring chances uses the following criteria:
- In the low danger zone, unblocked rebounds and rush shots only.
- In the medium danger zone, all unblocked shots.
- In the high danger zone, all shot attempts (since blocked shots taken here may be more representative of more “wide-open nets”, though we don’t know this for sure.)
The low danger zone would be your point and bad angle shots. Medium danger zone is the high point/top of the circle. High danger zone is point-blank.
This isn’t perfect by any means. While it takes subjectivity out of the equation by using specific time frames based on measurable neutral/offensive zone events, it does not account for all hockey plays. For example, turnovers that occur at the point in the defensive zone and turn into rushes aren’t counted here. However, it is certainly a much more accurate step in the right direction.
This still uses event data –and not player/puck location– so there are some inaccuracies that are unavoidable. They make the best of what’s available, and in doing so have addressed the quantity and quality argument that has come up so many times.
How does this apply to players?
Much like with Corsi/Fenwick, you want players to be above 50% for their SCF% (Scoring Chance For %). I think the easiest way of looking at SCF% –and SCF%– is to look at it as CF%/FF% in terms of evaluation. Since we can evaluate the stat in the same manner, we can leverage usage charts in which we are all familiar. The only difference is changing the shading measurement from CF/FF to SCF. First the forwards:
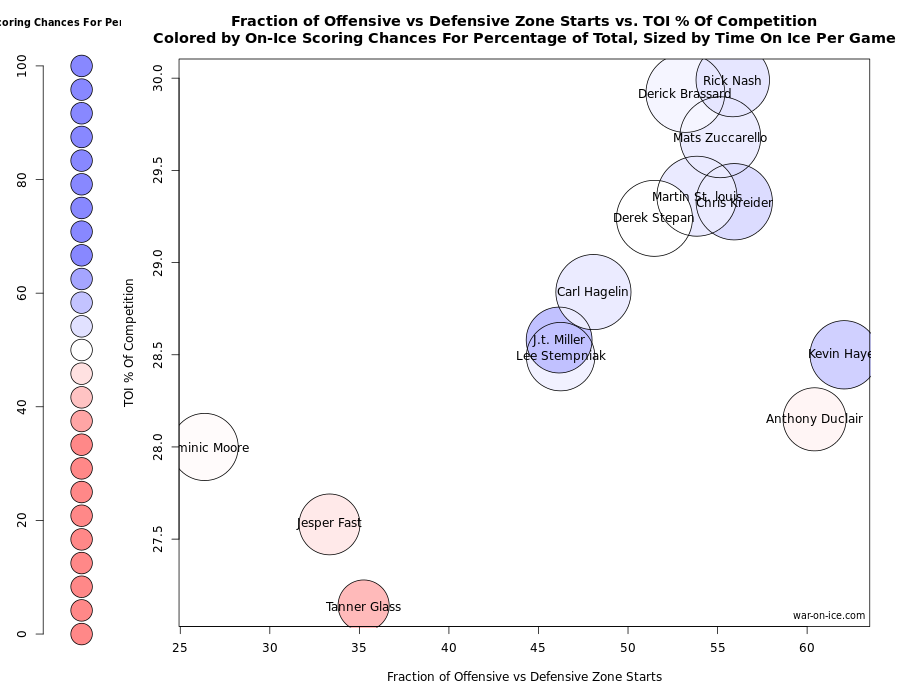
The location of the circles doesn’t change: We see the fourth line getting buried with defensive zone starts. We see the top-six getting the toughest competition. This stuff we know. However there are only three players who do not drive scoring chances (above 50% SCF): Tanner Glass, Jesper Fast, and Dominic Moore (omitting Anthony Duclair here). Those results are expected based on their usage.
One person that sticks out in a positive manner: J.T. Miller. He’s played 20 fewer games than the rest, but he leads the team in SCF% (58.7%), and he does so with roughly the same competition faced as Kevin Hayes (second on the club – 56.5% SCF), but in almost 20% fewer offensive zone starts. In short: Miller has done more to drive offense with less.
One person that troubles me is Derek Stepan, but we’ve covered that. He’s also trending upward, so it’s less of a concern now.
As for the defense:
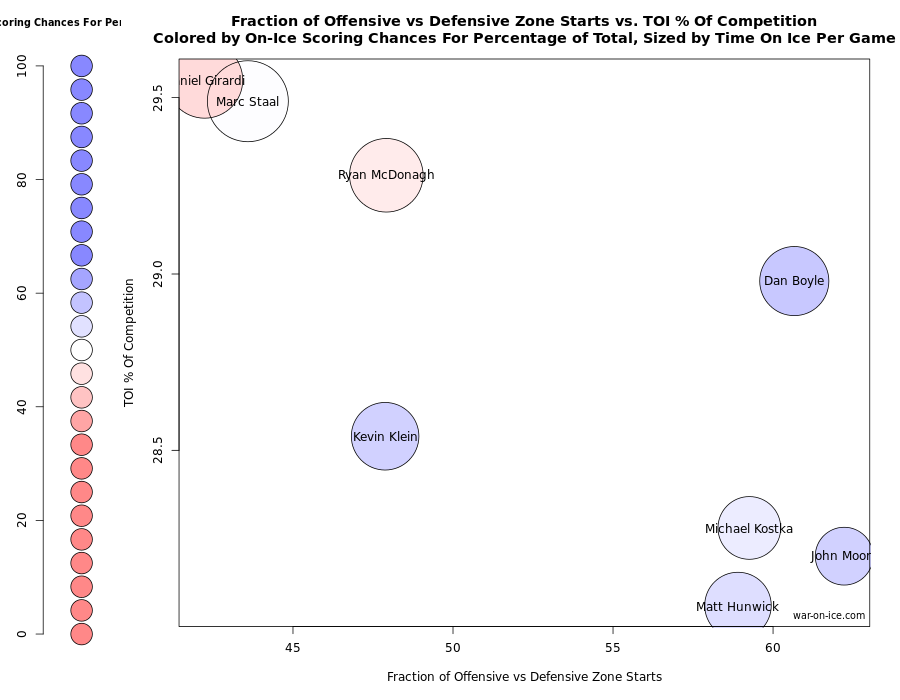
Kevin Klein has been one of the best Rangers defensemen this year, making a lot of us (mostly myself and Martin) eat our words from the beginning of the season. He’s not going to continue putting up numbers like this, but he’s been driving possession and is second to Dan Boyle in generating scoring chances, with less than 50% OZ starts (Boyle is above 60%).
The two guys who are below 50% SCF are the ones you’d expect: Dan Girardi and Ryan McDonagh. Not to beat a dead horse: But I’d love to see what McDonagh can do without Girardi as his partner. None of the metrics we’ve looked at have favored Girardi, and we’ve seen this on the ice too (gets beat, out of position, always laying on the ice). Tough as nails though. Made of cyborg parts. Marc Staal is at 50% actually, which is nice to see.
SCF% is going to be my preferred method of measuring performance going forward. It combines the quantity measurement of CF/FF with the quality aspect that has been relatively difficult to define. It’s not perfect –bear in mind that nothing is perfect. Even in baseball, where these stats are most advanced, nothing is perfect, including WAR.– but it is certainly a much more accurate step that should please those looking for quality attempts in their analysis.
Share:
More About:Analysis